XRP price shows bottoming signs as bullish chart patterns emerge


XRP price was flat on Monday as crypto investors awaited the next catalyst and as some notable bullish patterns began to emerge.
- XRP price has formed a triple bottom pattern on the daily chart.
- It has also formed an inverse head-and-shoulders pattern.
- These patterns point to an eventual rebound in the near term.
Ripple (XRP) token was trading at $1.8700 today, Dec. 29, down by nearly 50% from its highest point this year.
XRP’s price action mirrors that of other top coins. For example, Bitcoin (BTC) continues to reject the $90,000 resistance zone, whereas Ethereum remains below the $3,000 support level.
The crypto market is experiencing low volume in the futures and spot markets, as many traders are still on holiday. CoinMarketCap data show that the 24-hour volume stood at $104 billion, while XRP’s was at $2 billion.
XRP’s futures open interest has dropped to $3.48 billion from the year-to-date high of over $10 billion. A decline in open interest is a sign of low market demand and liquidity.
XRP has had some important catalysts this year. For example, the SEC has approved several XRP ETFs, which have accumulated over $1.2 billion in inflows. Similarly, the Ripple USD stablecoin has continued adding assets and now has over $1.4 billion in circulation.
Ripple Labs has made four major acquisitions this year: GTreasury, Hidden Road, Rail, and Palisade. These buyouts will likely leverage the XRP Ledger, RLUSD stablecoin, and the new banking charter.
XRP price technical analysis
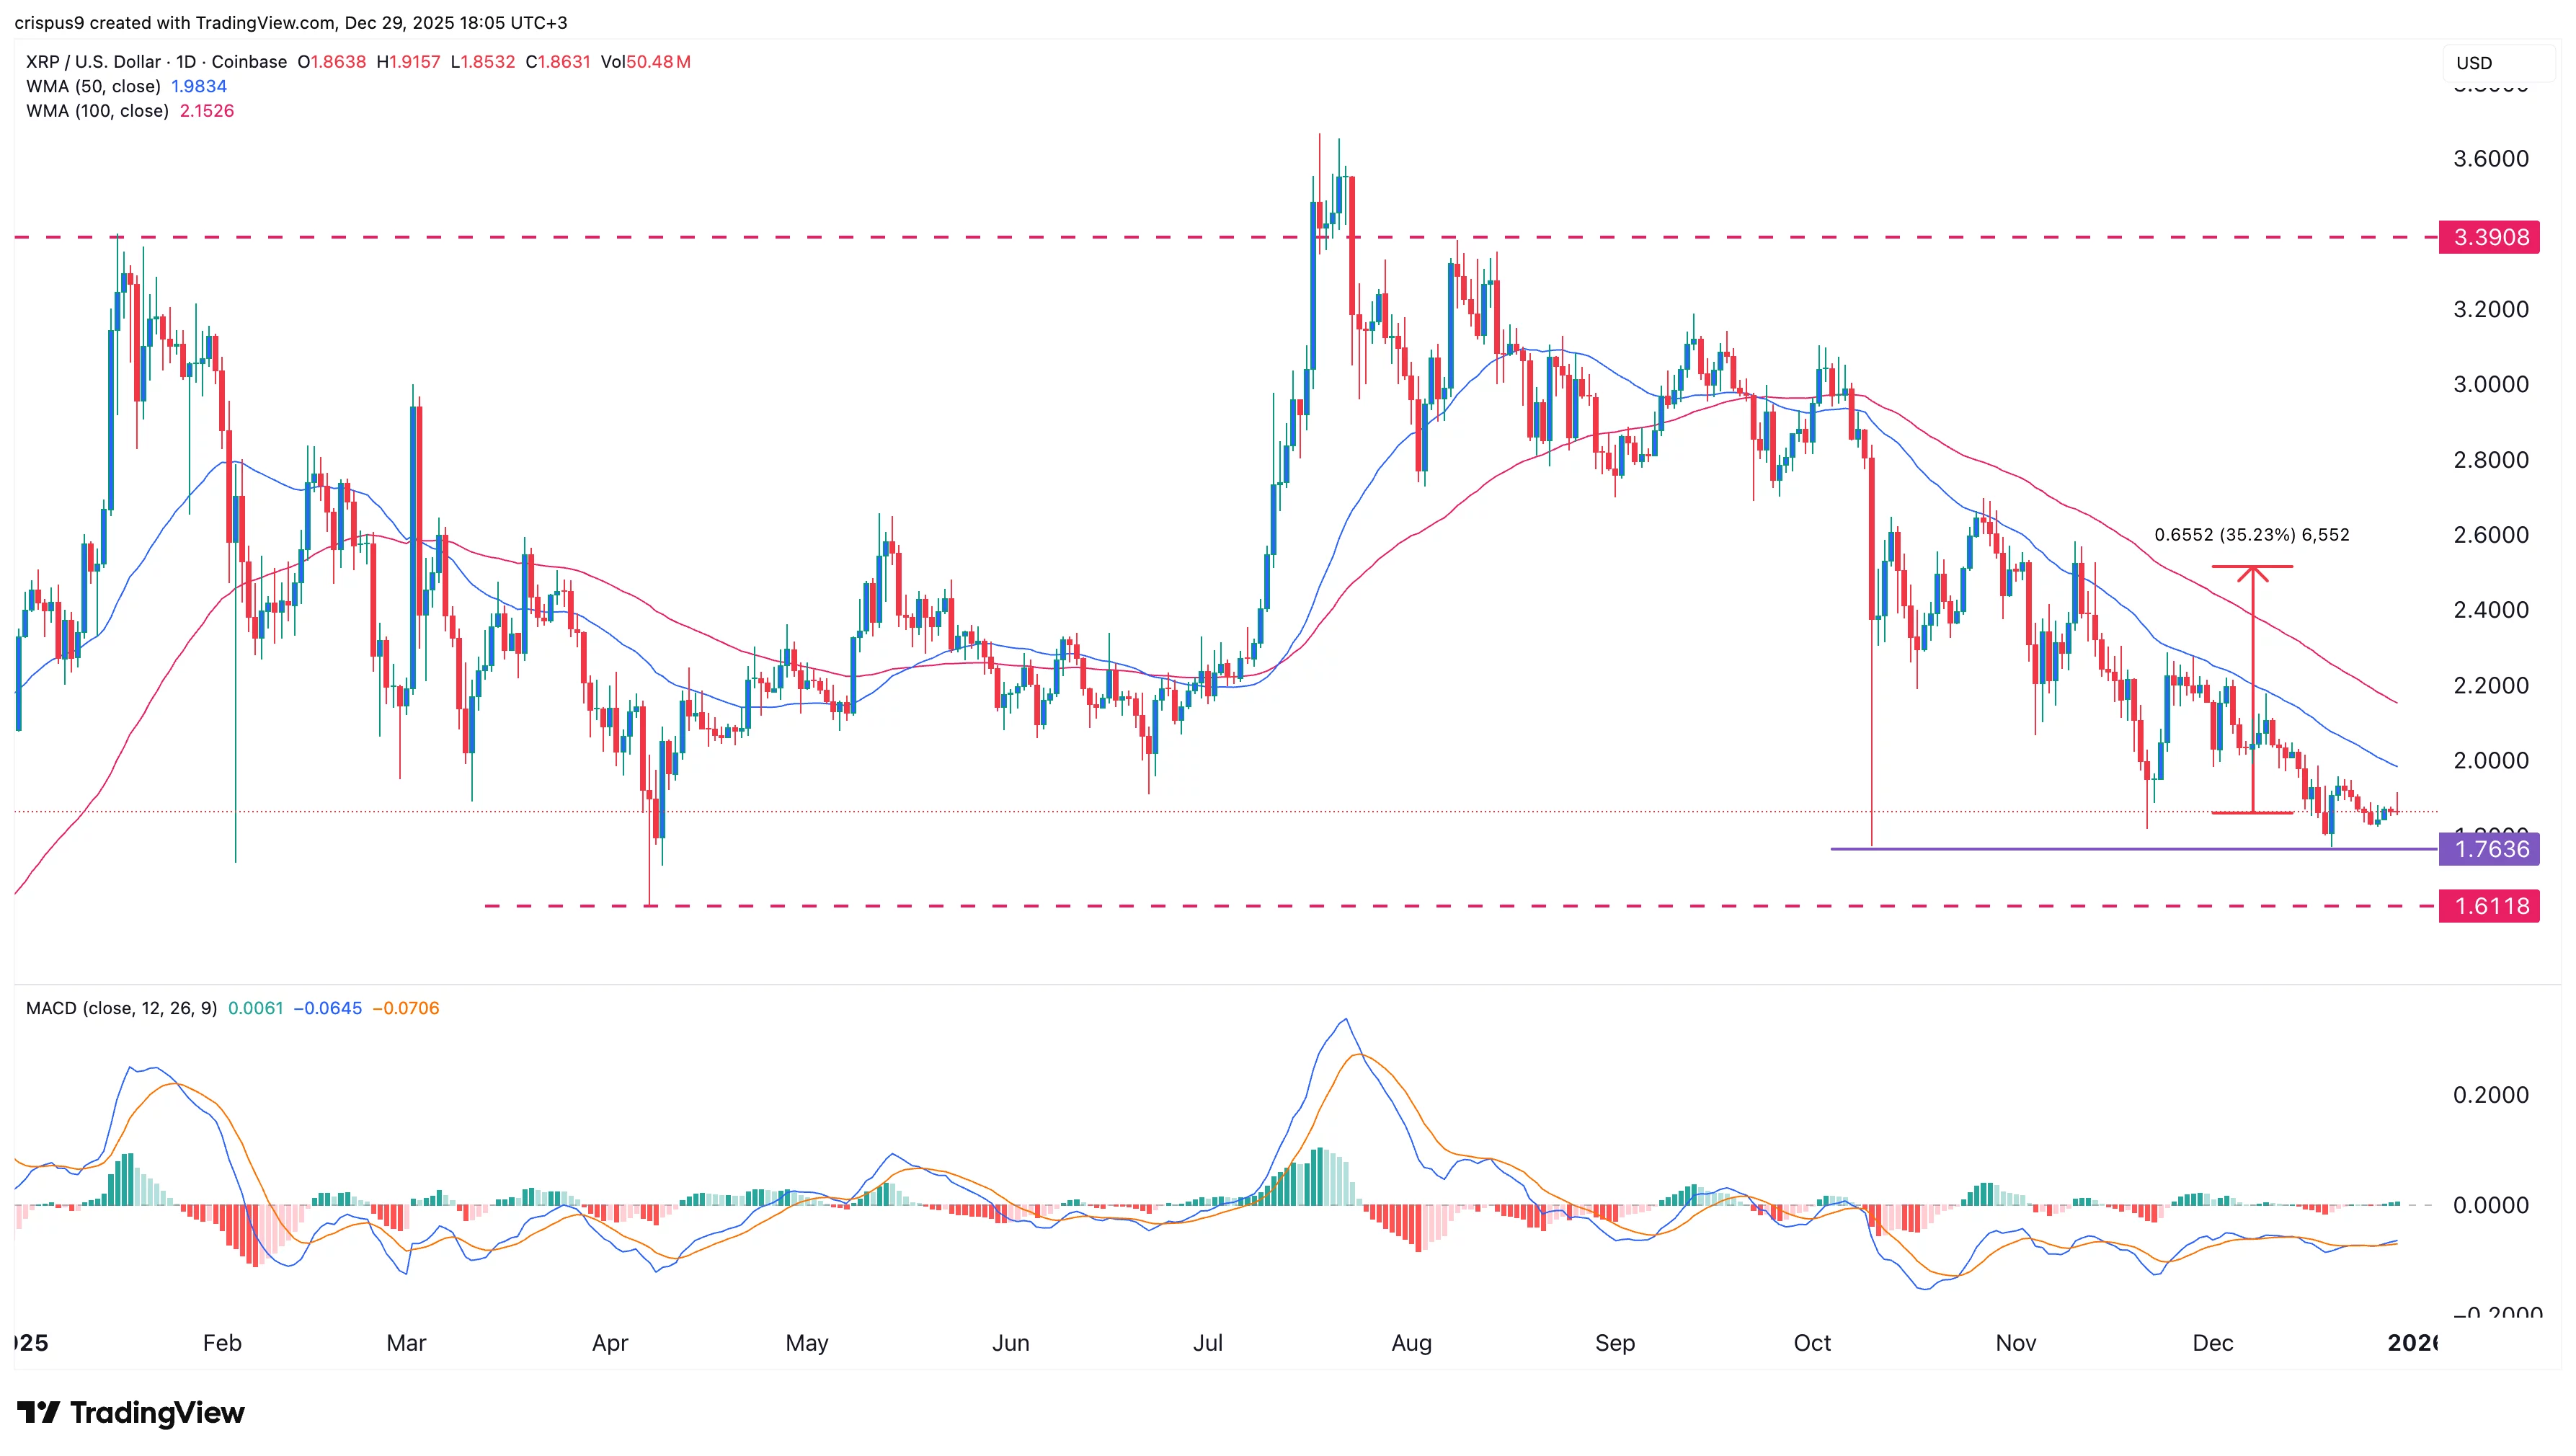
The daily chart shows that the Ripple price is slowly showing bottoming signs. It has formed a triple bottom at $1.76, a level it has failed to move below three times since October this year. A triple bottom is one of the most common bullish reversal patterns.
The token has also formed an inverse head-and-shoulders pattern, while the MACD indicator indicates bullish divergence.
Therefore, the most likely XRP price prediction is neutral with a bullish bias. A move above the 50-weighted moving average and the neckline of the inverse head-and-shoulders pattern will confirm the bullish breakout.
A rebound may push the token to the next psychological level at $2.50, approximately 35% above the current level. Conversely, a drop below the triple-bottom level at $1.7636 will invalidate the bullish outlook.