XRP price faces correction risk as new sell signal tests recent uptrend


XRP price is holding steady near $2.60 as a key sell signal tests its recent rally, with whales and possible exchange-traded fund approvals anchoring market confidence.
- TD Sequential flashes a short-term XRP sell signal after a strong weekly gain.
- Whale accumulation and ETF optimism support long-term upside.
- Technical setup shows consolidation with cautious bullish momentum.
XRP slipped 0.4% over the past 24 hours to trade at $2.63 at press time. The toke is up 9.4% in the past week but down another 9.4% over the last month. At current prices, XRP is about 27% below its July peak of $3.65.
Trading volume rose 15% to $4.9 billion, showing renewed participation even as short-term sentiment wavers. CoinGlass data shows that XRP (XRP) open interest rose 0.42% to $4.55 billion, while derivatives volume fell 3.18% to $8.46 billion.
This mix suggests that traders are reducing their aggressive short-term bets while holding onto their open positions, which is frequently a sign of consolidation before a big move.
TD Sequential flags possible pause in XRP uptrend
The TD Sequential, a momentum-based indicator that monitors price exhaustion and trend reversals, has issued a new sell signal, according to an Oct. 29 post on X by analyst Ali Martinez. The tool has accurately identified XRP’s turning points over the past three months.
Given its most recent sell signal, which points to a possible cooldown following recent gains, the uptrend may find it difficult to break above $2.70 in the near future.
Still, large holder activity remains strong. Santiment data shows wallets holding 10–100 million XRP added roughly 190 million tokens in late October, worth about $505–560 million.
Addresses with over 10,000 XRP also reached a record 317,500, showing steady accumulation ahead of possible ETF approvals. Analysts put the odds of approval between 95% and 100%, a move that could attract $4–10 billion in inflows.
Ripple’s broader expansion adds to the long-term outlook. The company’s application for a U.S. national trust bank license is under review by the OCC, with a decision expected in the coming weeks. If approved, it would allow Ripple to access a Federal Reserve master account and expand its On-Demand Liquidity services used by over 1,700 institutions.
In addition, its recent $1 billion acquisition of GTreasury further supports plans to use XRP in corporate finance through a new $1B XRP treasury program.
XRP price technical analysis
The daily chart for XRP shows consolidation between $2.34 and $2.69. Bollinger Bands are getting narrower, which indicates less volatility in the future. While the MACD displays a slight bullish crossover, the relative strength is at 50, indicating neutral momentum.
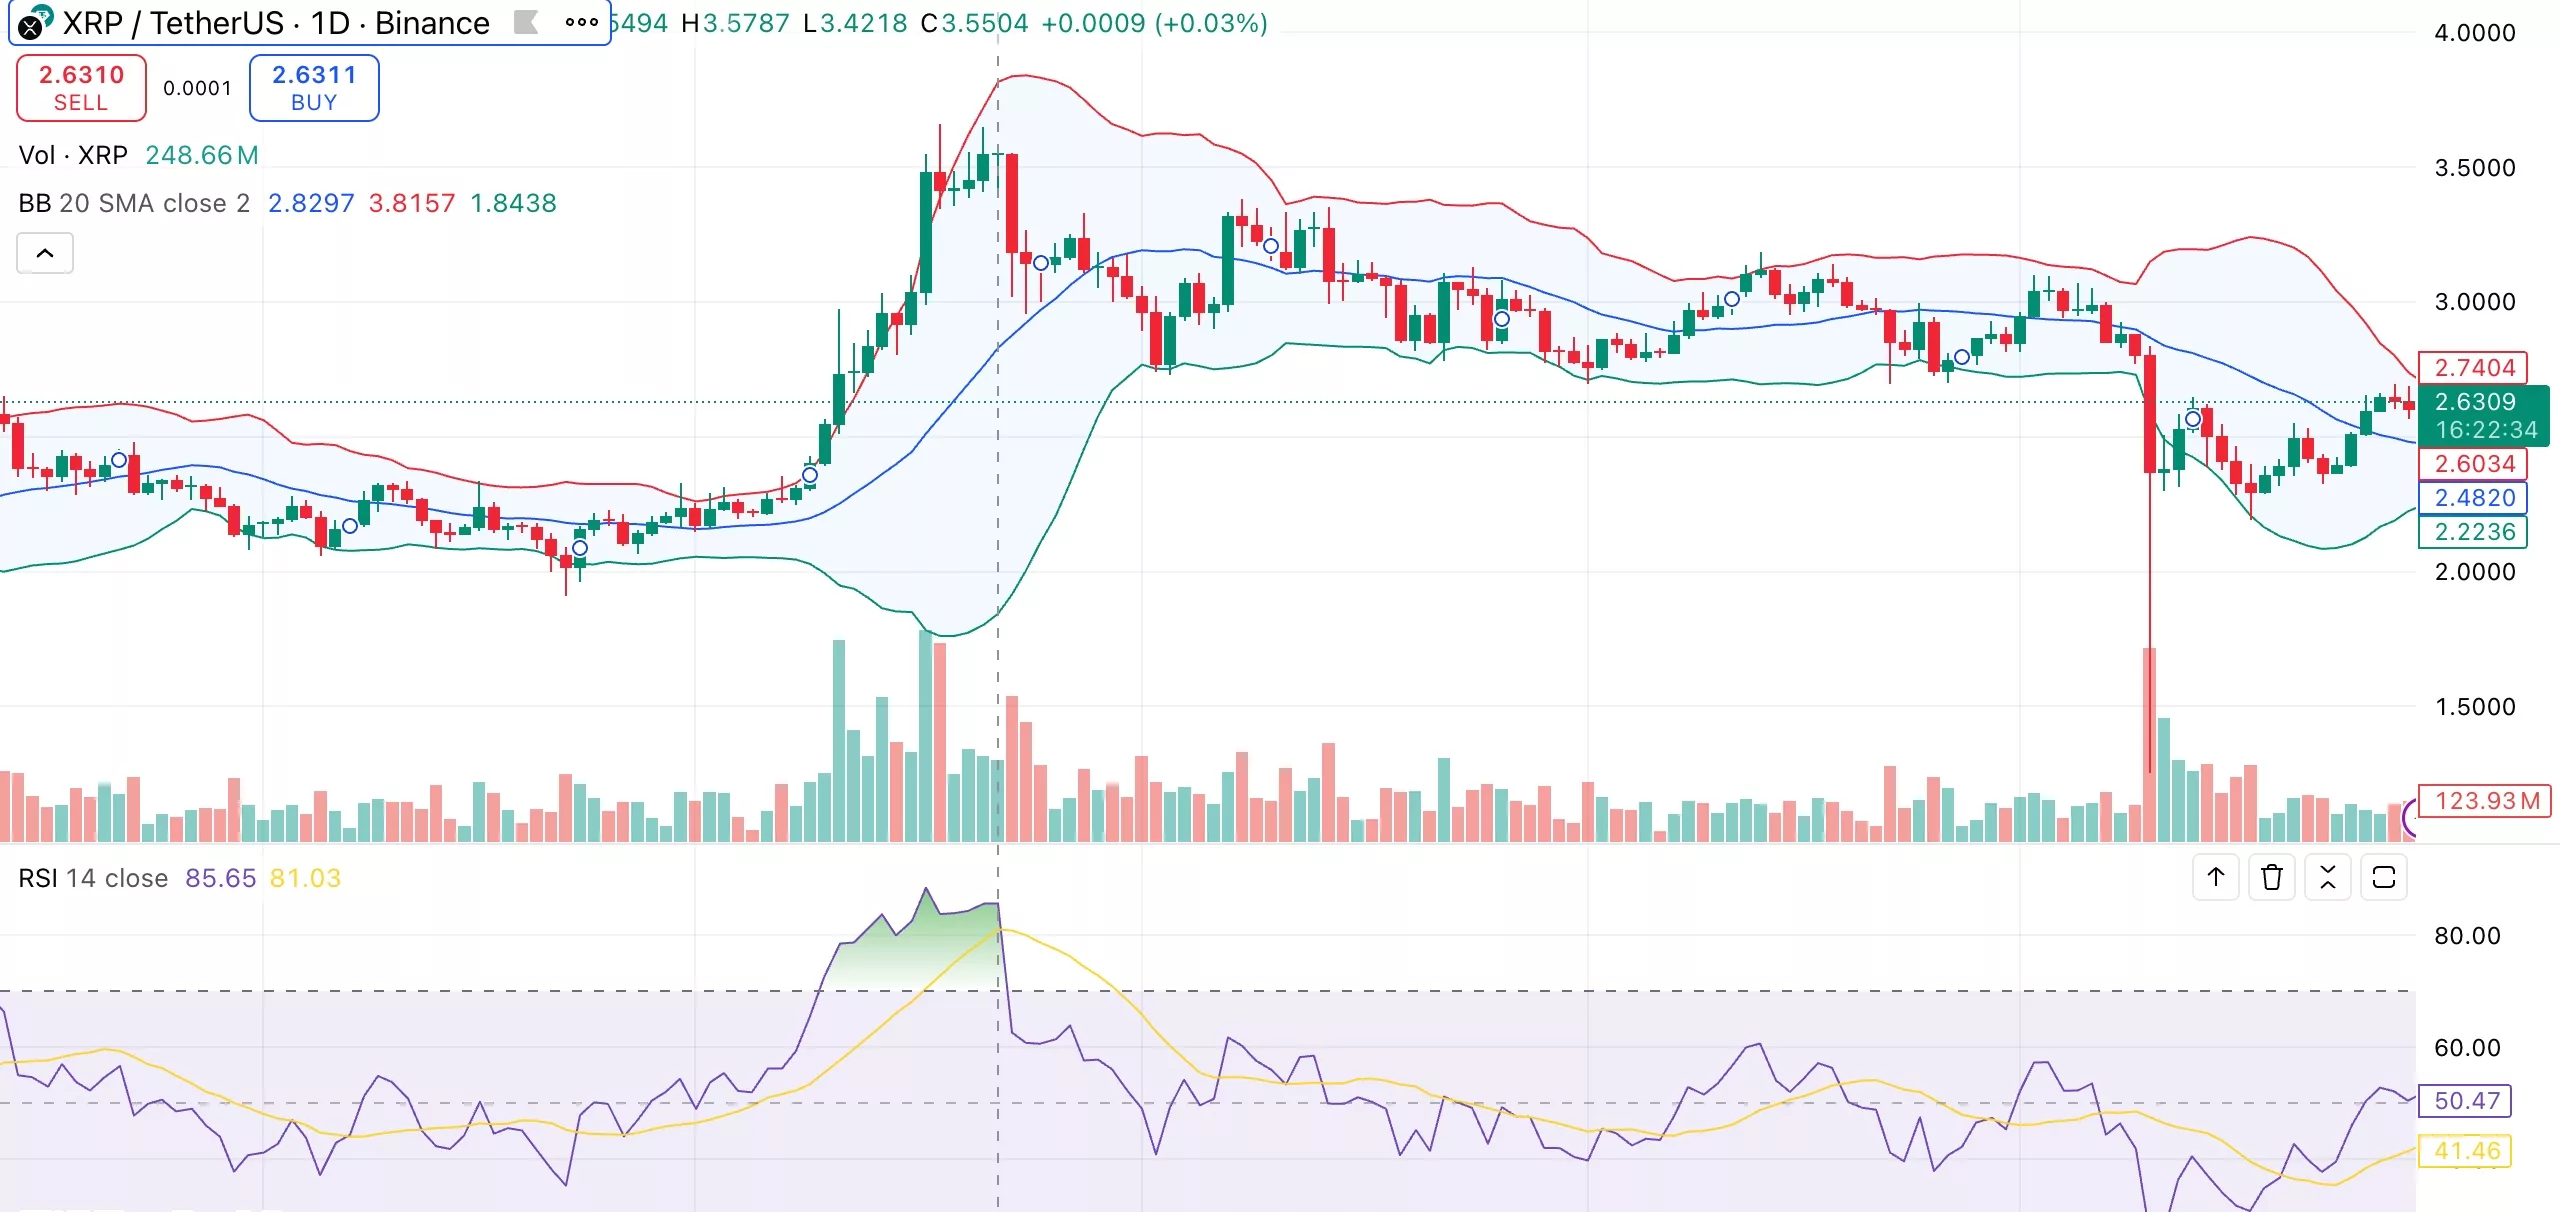
The majority of short-term moving averages (10–30 days) show buying pressure, but longer-term averages (50–100 days) continue to be bearish, highlighting a cautious setup.
If whale accumulation persists, a sustained move above $2.70 may pave the way to $3.00 and possibly a retest of July highs. On the other hand, a decline below $2.40 could confirm the sell signal from the TD Sequential and push losses down towards $2.20.