Will Solana price rebound as its key metrics beat Ethereum?


Solana price remained under pressure this week, continuing a downward trend that started in September last year when it peaked at $252.
- Solana price continued its strong downward trend this week.
- Key network metrics like active addresses and transactions continued soaring.
- Its ETF inflows continued rising and is beating Ethereum.
Solana (SOL) token dropped for eight consecutive weeks and is now hovering near its lowest level since January 2024. It has dropped by over 73% from its highest level in January last year.
The ongoing Solana price crash continued even as the network growth gained momentum and beat Ethereum (ETH) on key metrics.
For example, data compiled by SoSoValue shows that spot Solana ETFs added over $61 million in inflows this month. They have added assets in the last five consecutive months, bringing the cumulative inflows to over $932 million. These funds now hold over $795 million in assets under management.
On the other hand, Ethereum ETFs shed over $326 million in assets in February. They have shed over $2 billion in the last four months, bringing the cumulative net assets inflows to over $11.6 billion.
Solana is also beating Ethereum in other areas, by far. For example, data compiled by Nansen shows that Solana handled over 2.6 billion transactions in the last 30 days, while Ethereum processed 66.7 million.
Similarly, Solana made over $25 million in fees, while Ethereum made $18 million in the same period. These fees made it the second most profitable chain in the crypto industry after Justin Sun’s Tron.
Meanwhile, the number of active addresses in Ethereum dropped by 5.3% in the last 30 days, while Solana’s rose by 30% to over 114 million.
Solana price prediction: Technical analysis
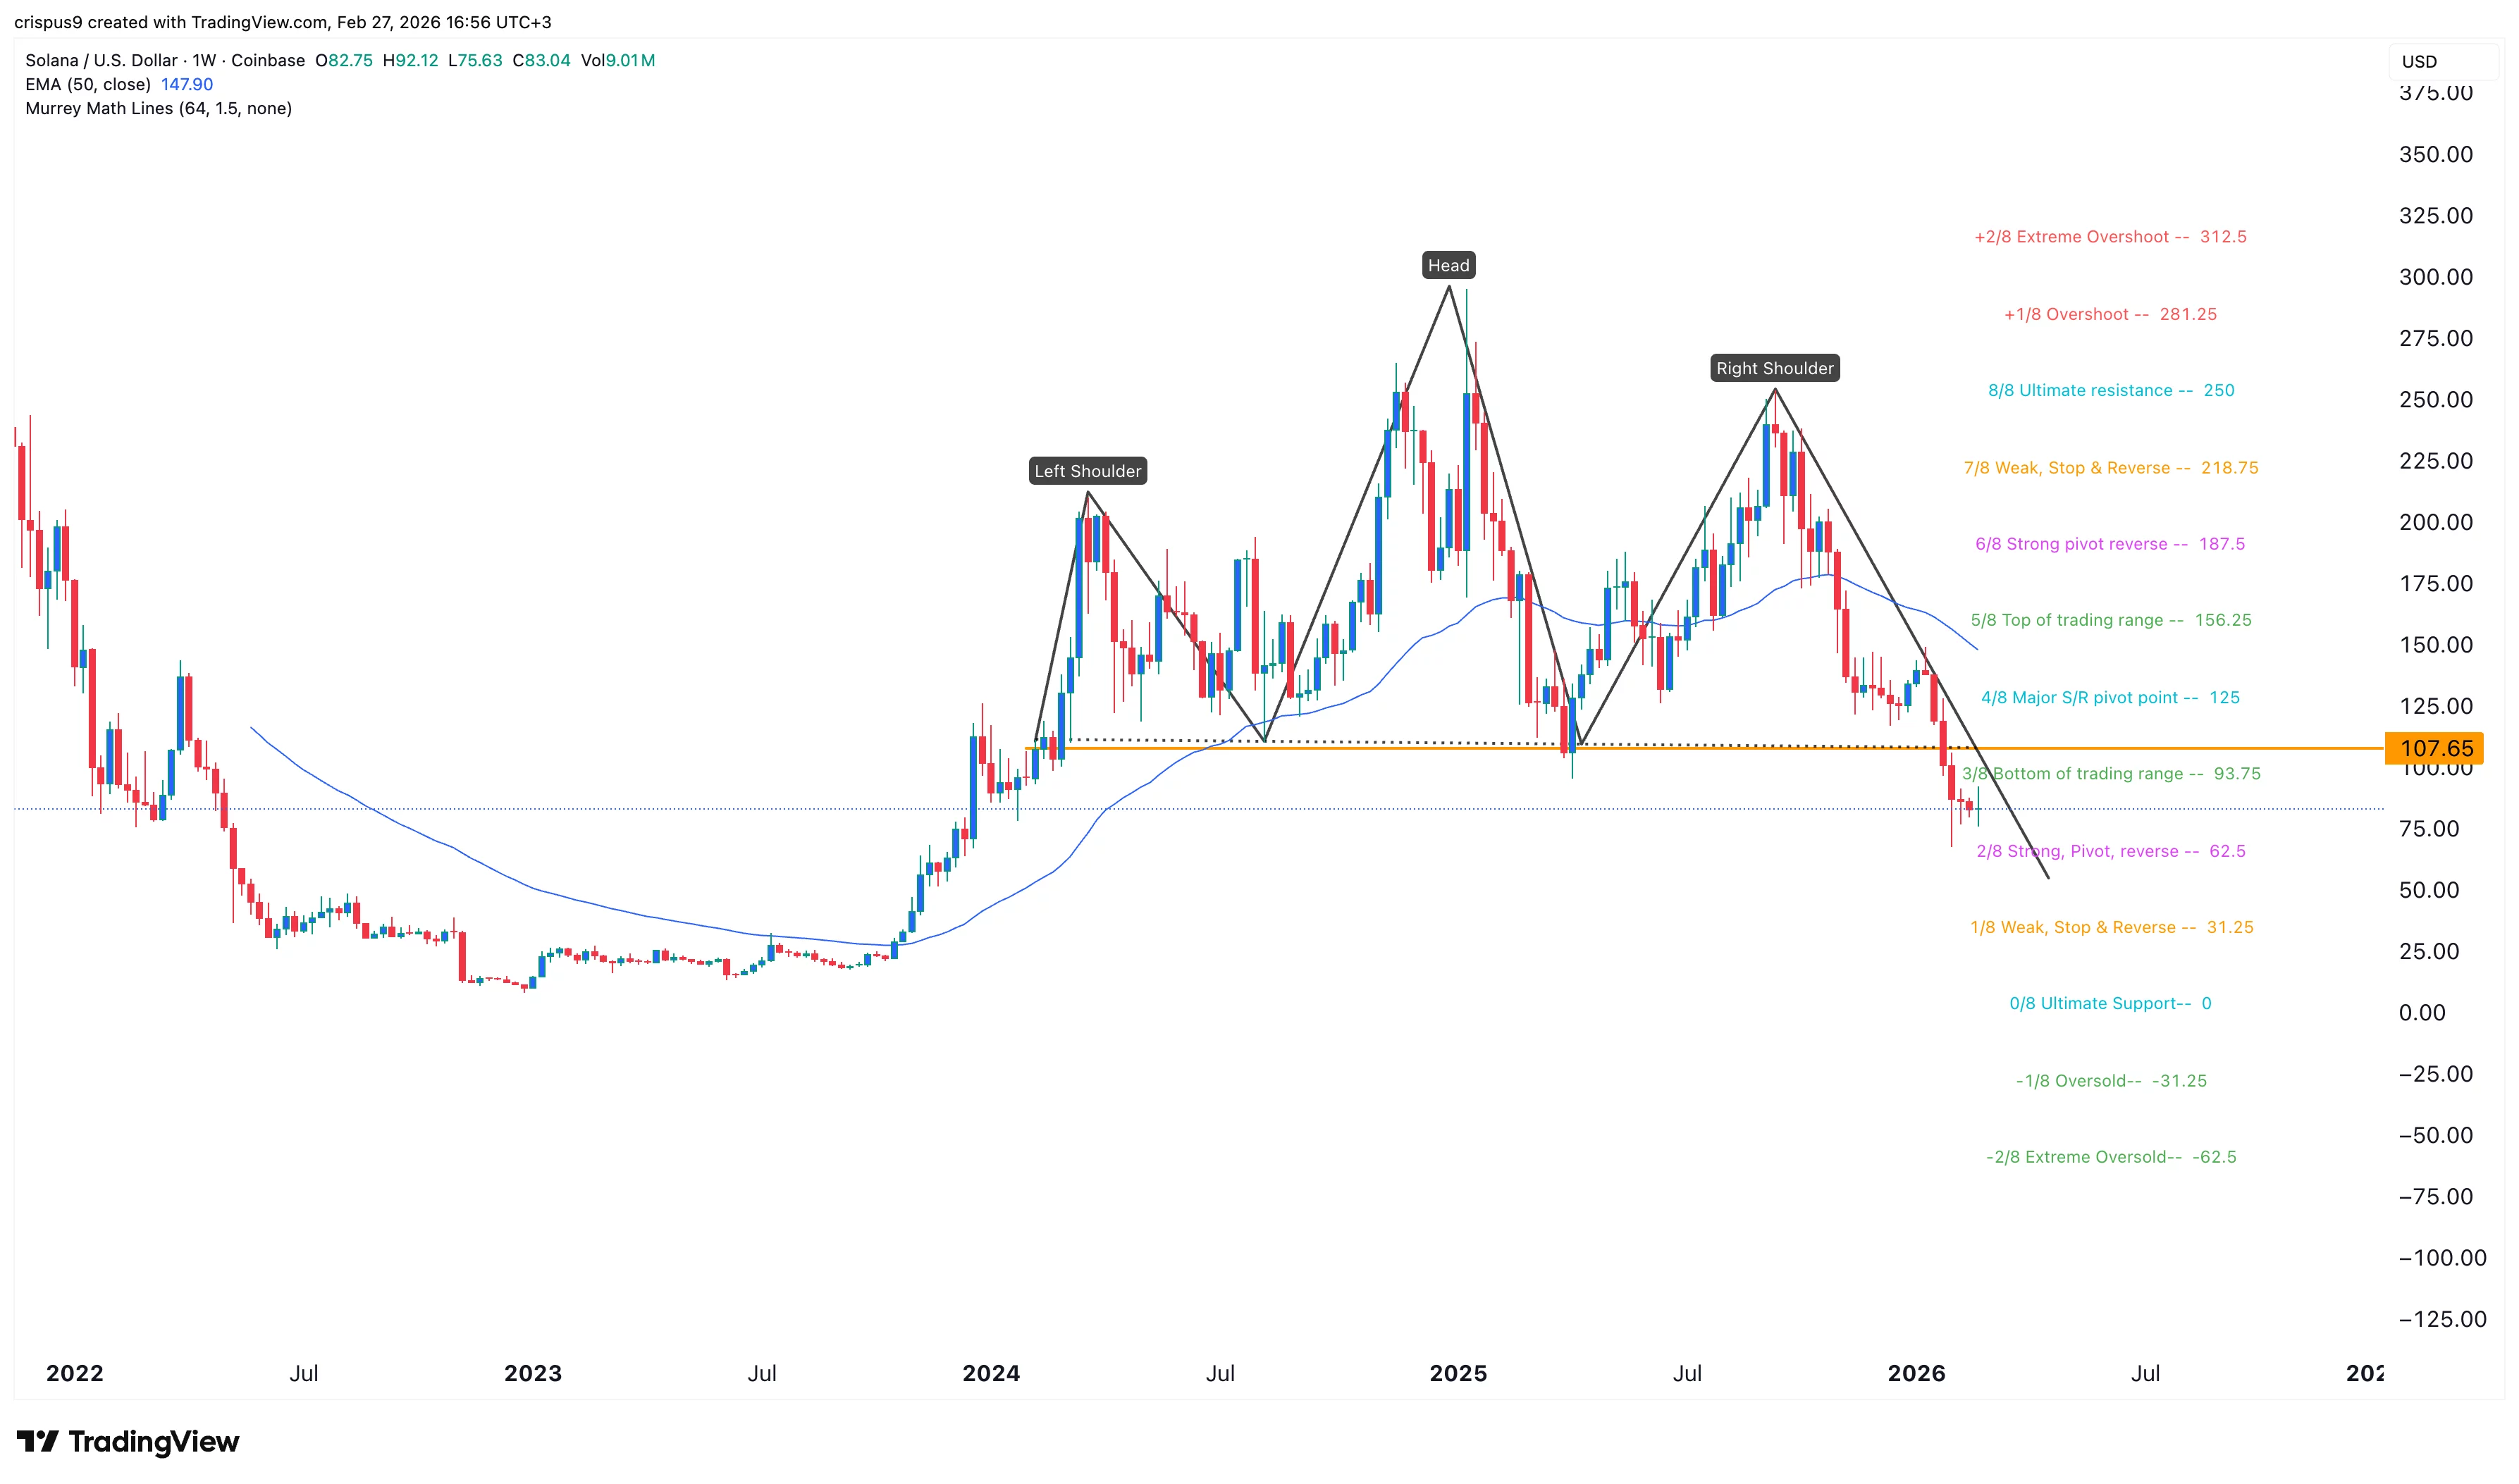
The weekly timeframe chart shows that SOL price has remained in a bear market in the past few months. It has dropped below the key support level at $107, the neckline of the head-and-shoulders chart pattern.
The token has dropped below the key support level at $93.75, the Bottom of trading range of the Murrey Math Lines tool. It also remains below the 50-week and 100-week Exponential Moving Averages.
Solana also remains below the Supertrend indicator. Therefore, the token will likely continue falling, potentially to the Strong, Pivot, and Reverse of the Murrey Math Lines tool at $62.5.
The coin will then bounce back when the ongoing crypto market crash fades, which may happen in the next few weeks or months.