Will Ethereum price drop below $1,500 as multiple bearish patterns emerge amid crypto market crash?


Ethereum price formed a bearish engulfing candle on Monday and dropped over 6% amidst a market-wide crash led by Bitcoin.
- Ethereum price fell over 6% on Monday amid a broader crypto market blood bath.
- Multiple bearish patterns seem to suggest more potential downside over the coming weeks.
- Ethereum ETFs have hit a 5-week outflow streak.
According to data from Coin Insider Daily, Ethereum (ETH) price fell 6.3% to $1,855 on Monday during early Asian hours before stabilizing at $1,874 at press time. Ethereum price tanked amid a broader market crash as fresh U.S. tariff threats on all trading partners and potential military escalation in the U.S. and Iran conflict hurt investor appetite for crypto assets.
Notably, Bitcoin (BTC), the bellwether of the market, has dropped below the $65,000 psychological support level, wiping out millions of leveraged long positions with the shock extending to other major crypto assets such as Ethereum. CoinGlass data show that nearly $108 million worth of ETH long positions were liquidated in the past 24 hours.
Ethereum price analysis
On the daily chart, Ethereum price has formed a bearish engulfing candle amid its drop today. The largest altcoin in the market has so far fallen roughly 45% from its yearly high and 62% from its all-time high of $4,946 reached in August 2025.
ETH’s price action has formed a bearish pennant pattern characterized by a flag-like pole and a triangle formation at the bottom. A breakout from such patterns has historically been followed by massive downside risks.
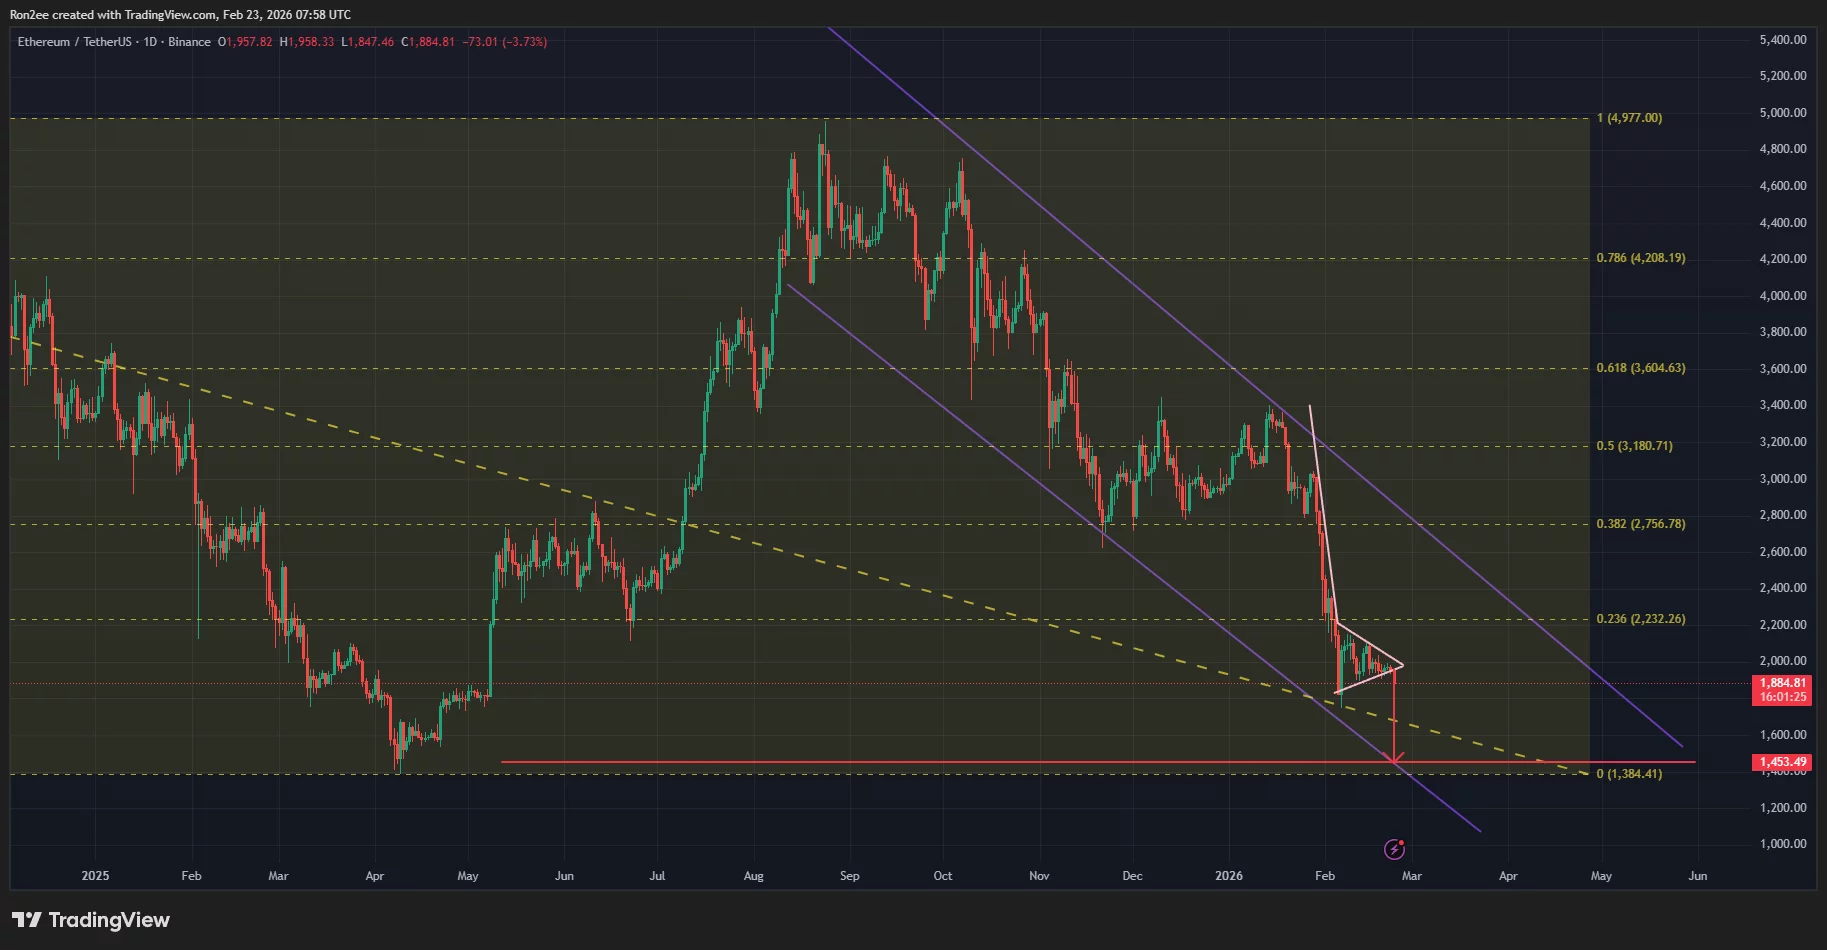
At the same time, zooming out the chart also shows the formation of a multi-month descending parallel channel, another bearish pattern in technical analysis.
Based on these technical indicators, Ethereum could drop to $1,450 if it were to respect the lower boundary of the descending channel pattern. This would mean loss of the $1,500 level, which is an important psychological support.
A breach of the $1,500 psychological floor would represent a significant structural breakdown, likely triggering a cascade of stop-losses. Given the current macro-driven volatility, it could result in a rapid capitulation phase in the coming sessions as liquidity dries up at lower levels.
ETH investors have turned bearish
The bearish prediction for Ethereum could gain further traction from the lackluster demand for its exchange-traded products over recent weeks. Data from SoSoValue shows that the nine-spot Ethereum ETFs have recorded back-to-back outflows for the fifth consecutive week, totalling around $1.38 billion.
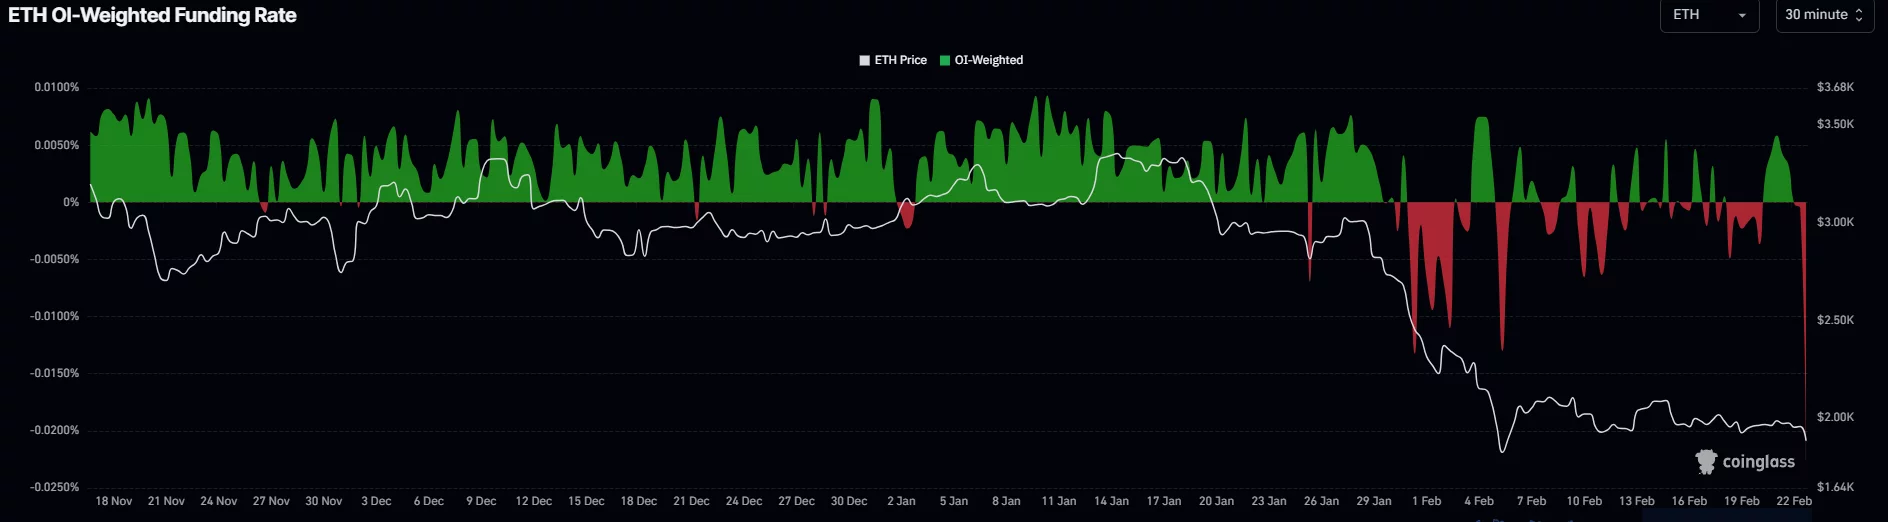
Meanwhile, the weighted funding rate, which measures the cost of holding short positions, has fallen deeply into the red territory, suggesting that Ethereum bears are increasingly betting on further price declines while paying a premium to long holders.
Disclosure: This article does not represent investment advice. The content and materials featured on this page are for educational purposes only.