MSTR stock faces 35% risk as MicroStrategy’s Bitcoin buying continues


MSTR stock price continued its recent downtrend on Monday as volatility in the crypto market remained.
- MSTR stock price continued its strong downward trend this week.
- MicroStrategy continued its Bitcoin accumulation strategy.
- Technical analysis suggests that MSTR may crash to $100 soon.
MicroStrategy dropped to $136, down by 75% from its all-time high. It then stabilized at $145 as Bitcoin (BTC) pared back some of its earlier losses and moved above $78,000.
Strategy also stabilized after the company revealed that it acquired 8555 coins worth over $75 million last week. It was its smallest purchase in three weeks.
The company now holds 713,502 coins, which it bought for the average price of $76,052. At its lowest level on Monday, Strategy’s unrealized losses jumped to over $900 milllion.
Strategy has access to more cash to continue it Bitcoin buying spree. Its buying report showed that it has access to over $8 billon worth of the MSTR stock to sell to raise capital. It also has $20 billion worth of STRK preferred shares, $4 billion of STRD, $3.6 billion of STRC, and $1.6 billion of STRD stock.
Therefore, there is a likelihood that Saylor will use the lower Bitcoin price to continue the accumulation. His view is that Bitcoin will ultimately bounce back and move to a new record high.
History shows that Bitcoin always rebounds whenever it crashes into a bear market. For example, BTC crashed by over 35% between its highest point in January last year and its lowest point in April. It then rebounded to a record high in May.
Bitcoin also slipped by over 70% between its highest level in 2021 and lowest level in 2022. It then surged from below $16,000 in 2022 to $126,200 in 2025. Therefore, the most likely scenario is where Bitcoin rebounds later this year.
MSTR stock price technical analysis
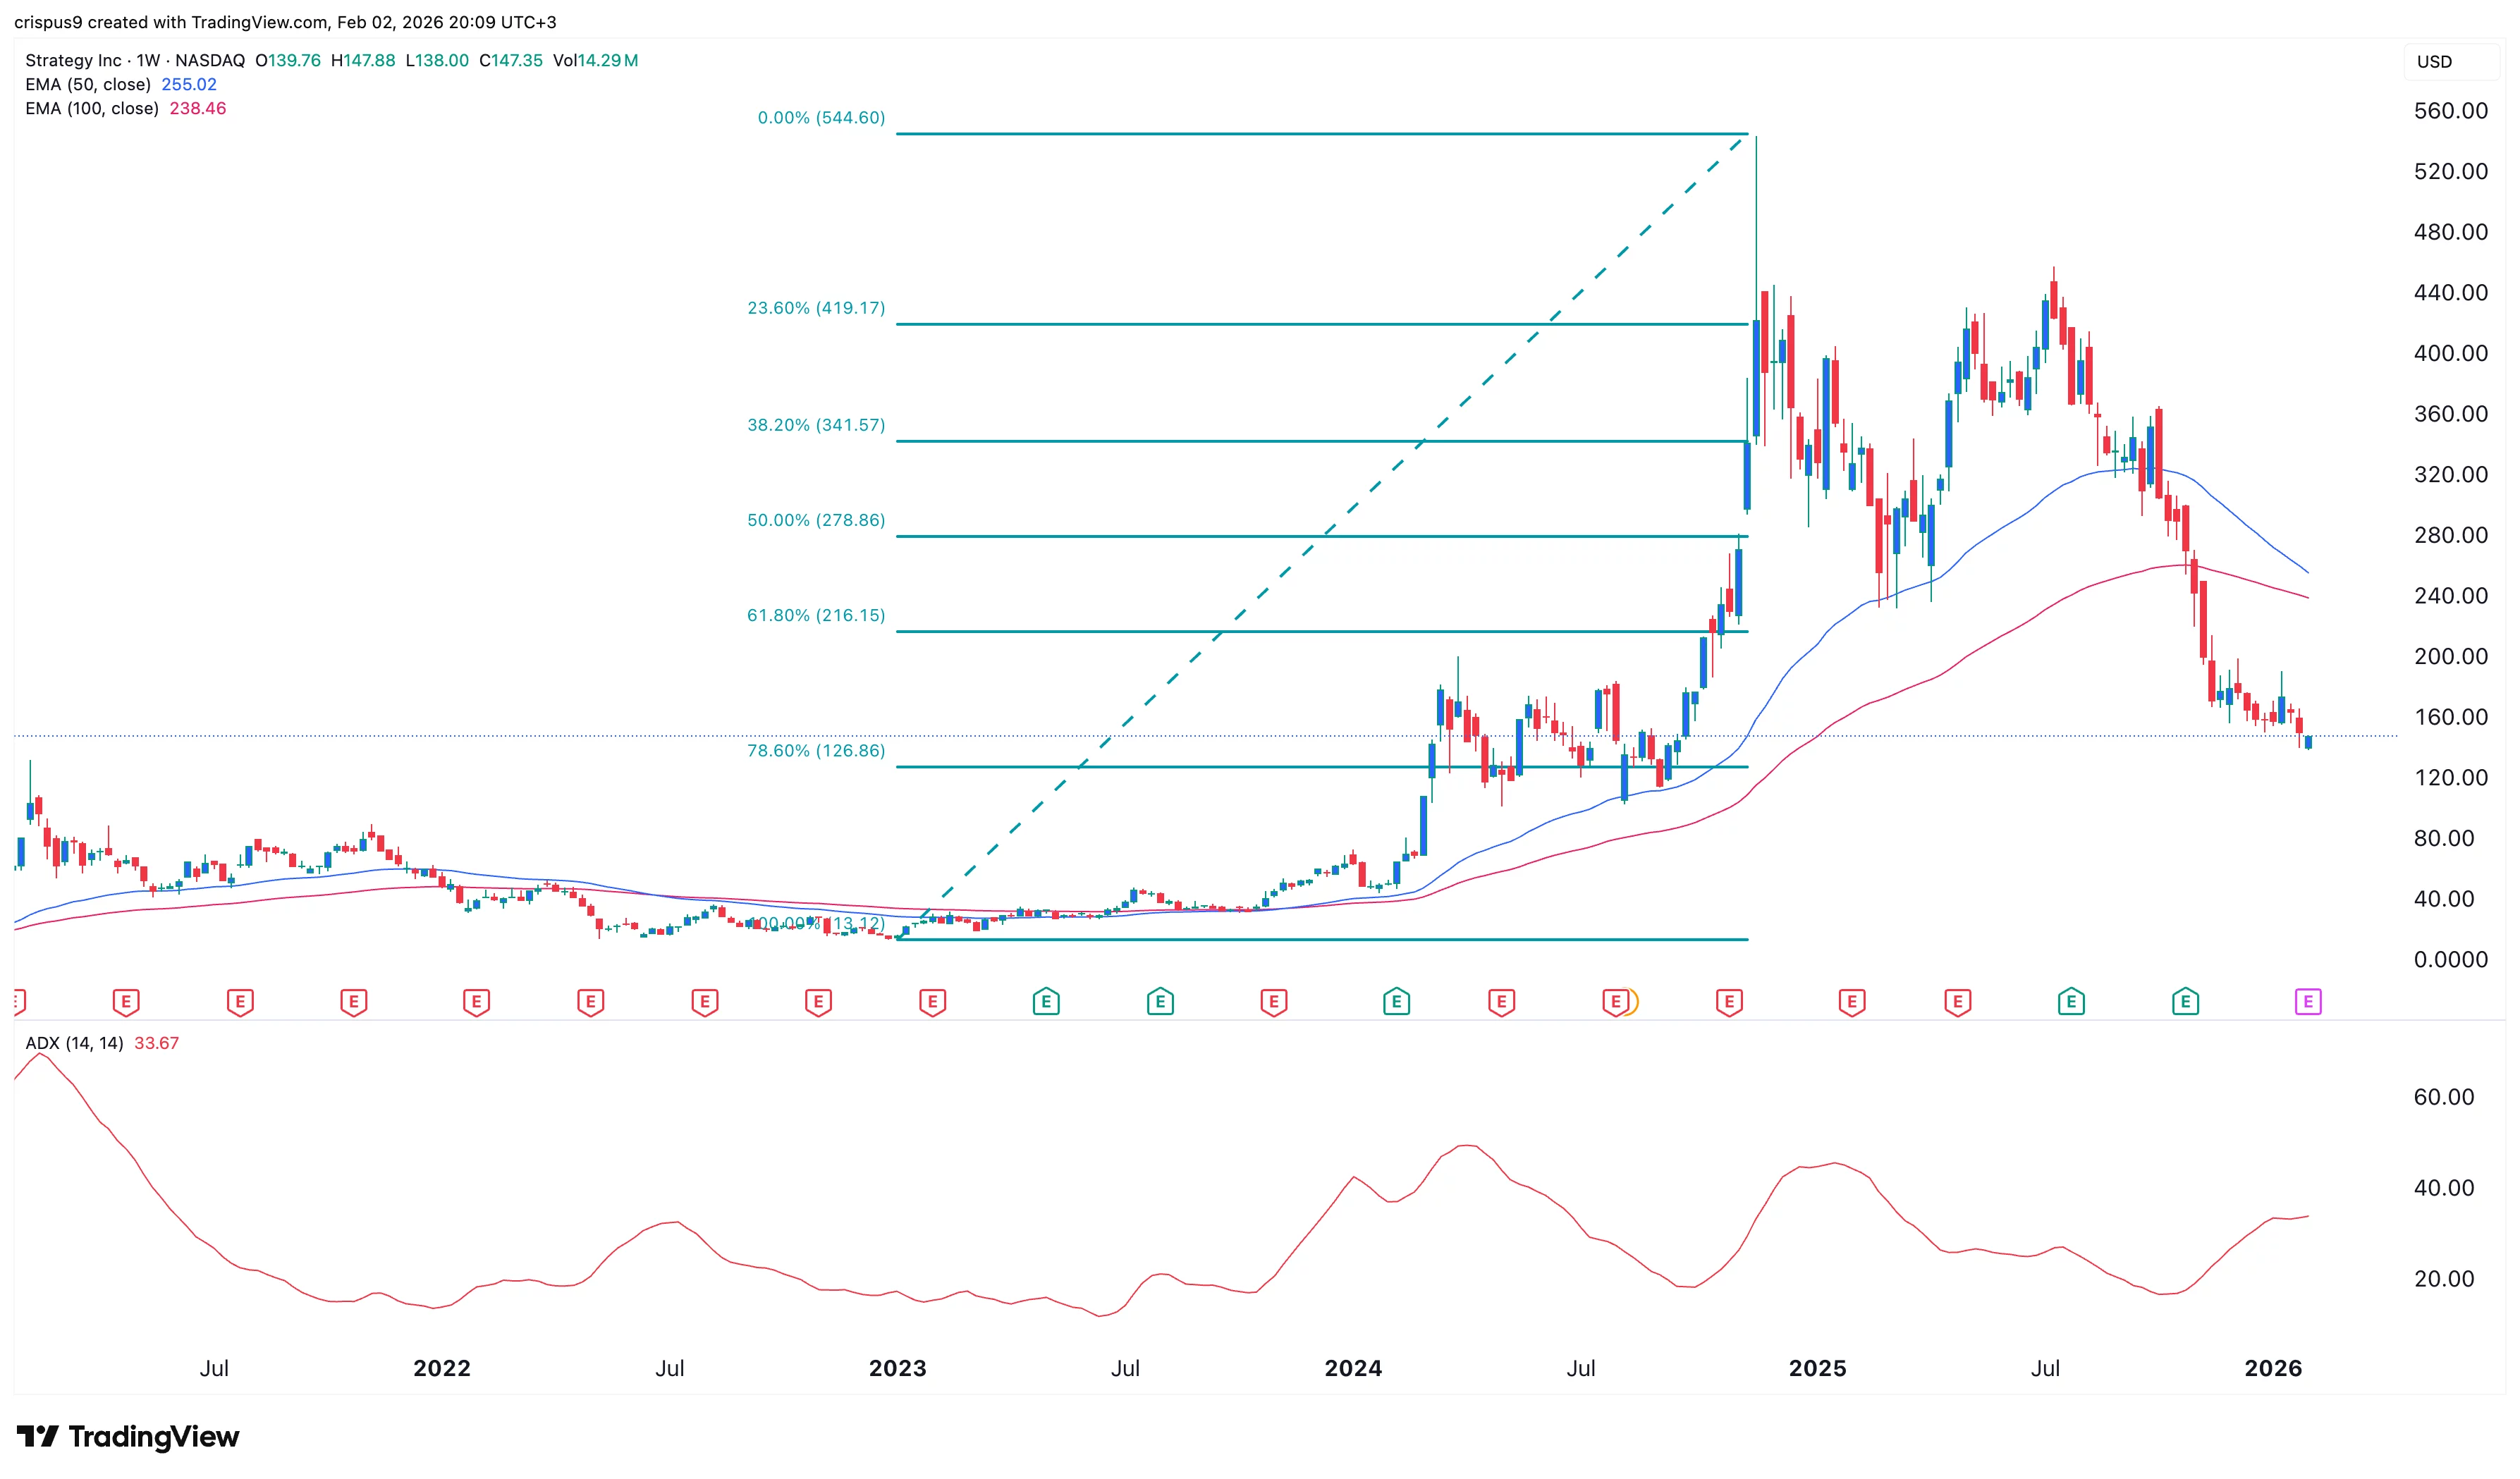
The weekly chart shows that the MicroStrategy share price has been in a strong downward trend. It has now crashed below the 61.8% Fibonacci Retracement level, confirming the downward trend.
The Average Directional Index has jumped to 33, its highest level since March last year. A soaring ADX indicator is a sign that the downward trend is gaining momentum.
The stock moved below all moving averages and the Supertrend indicator. Therefore, the most likely scenario is where it drops by 35% to $100 and then resumes the downward trend.