Ethereum price chart points to a comeback as exchange reserves dip


Ethereum’s price remained under increased pressure this week as ETF outflows rose and sentiment in the crypto industry worsened.
- Ethereum price has formed a big bullish flag pattern.
- It has remained above the 200-day moving average, pointing to a rebound.
- The supply of Ether tokens on exchanges has dropped to a multi-year low.
Ethereum (ETH) was trading at $3,900 at press time, down more than 21% from its highest point in September. Still, technical analysis suggests that the price may be ripe for a strong advance soon.
Ethereum price chart analysis
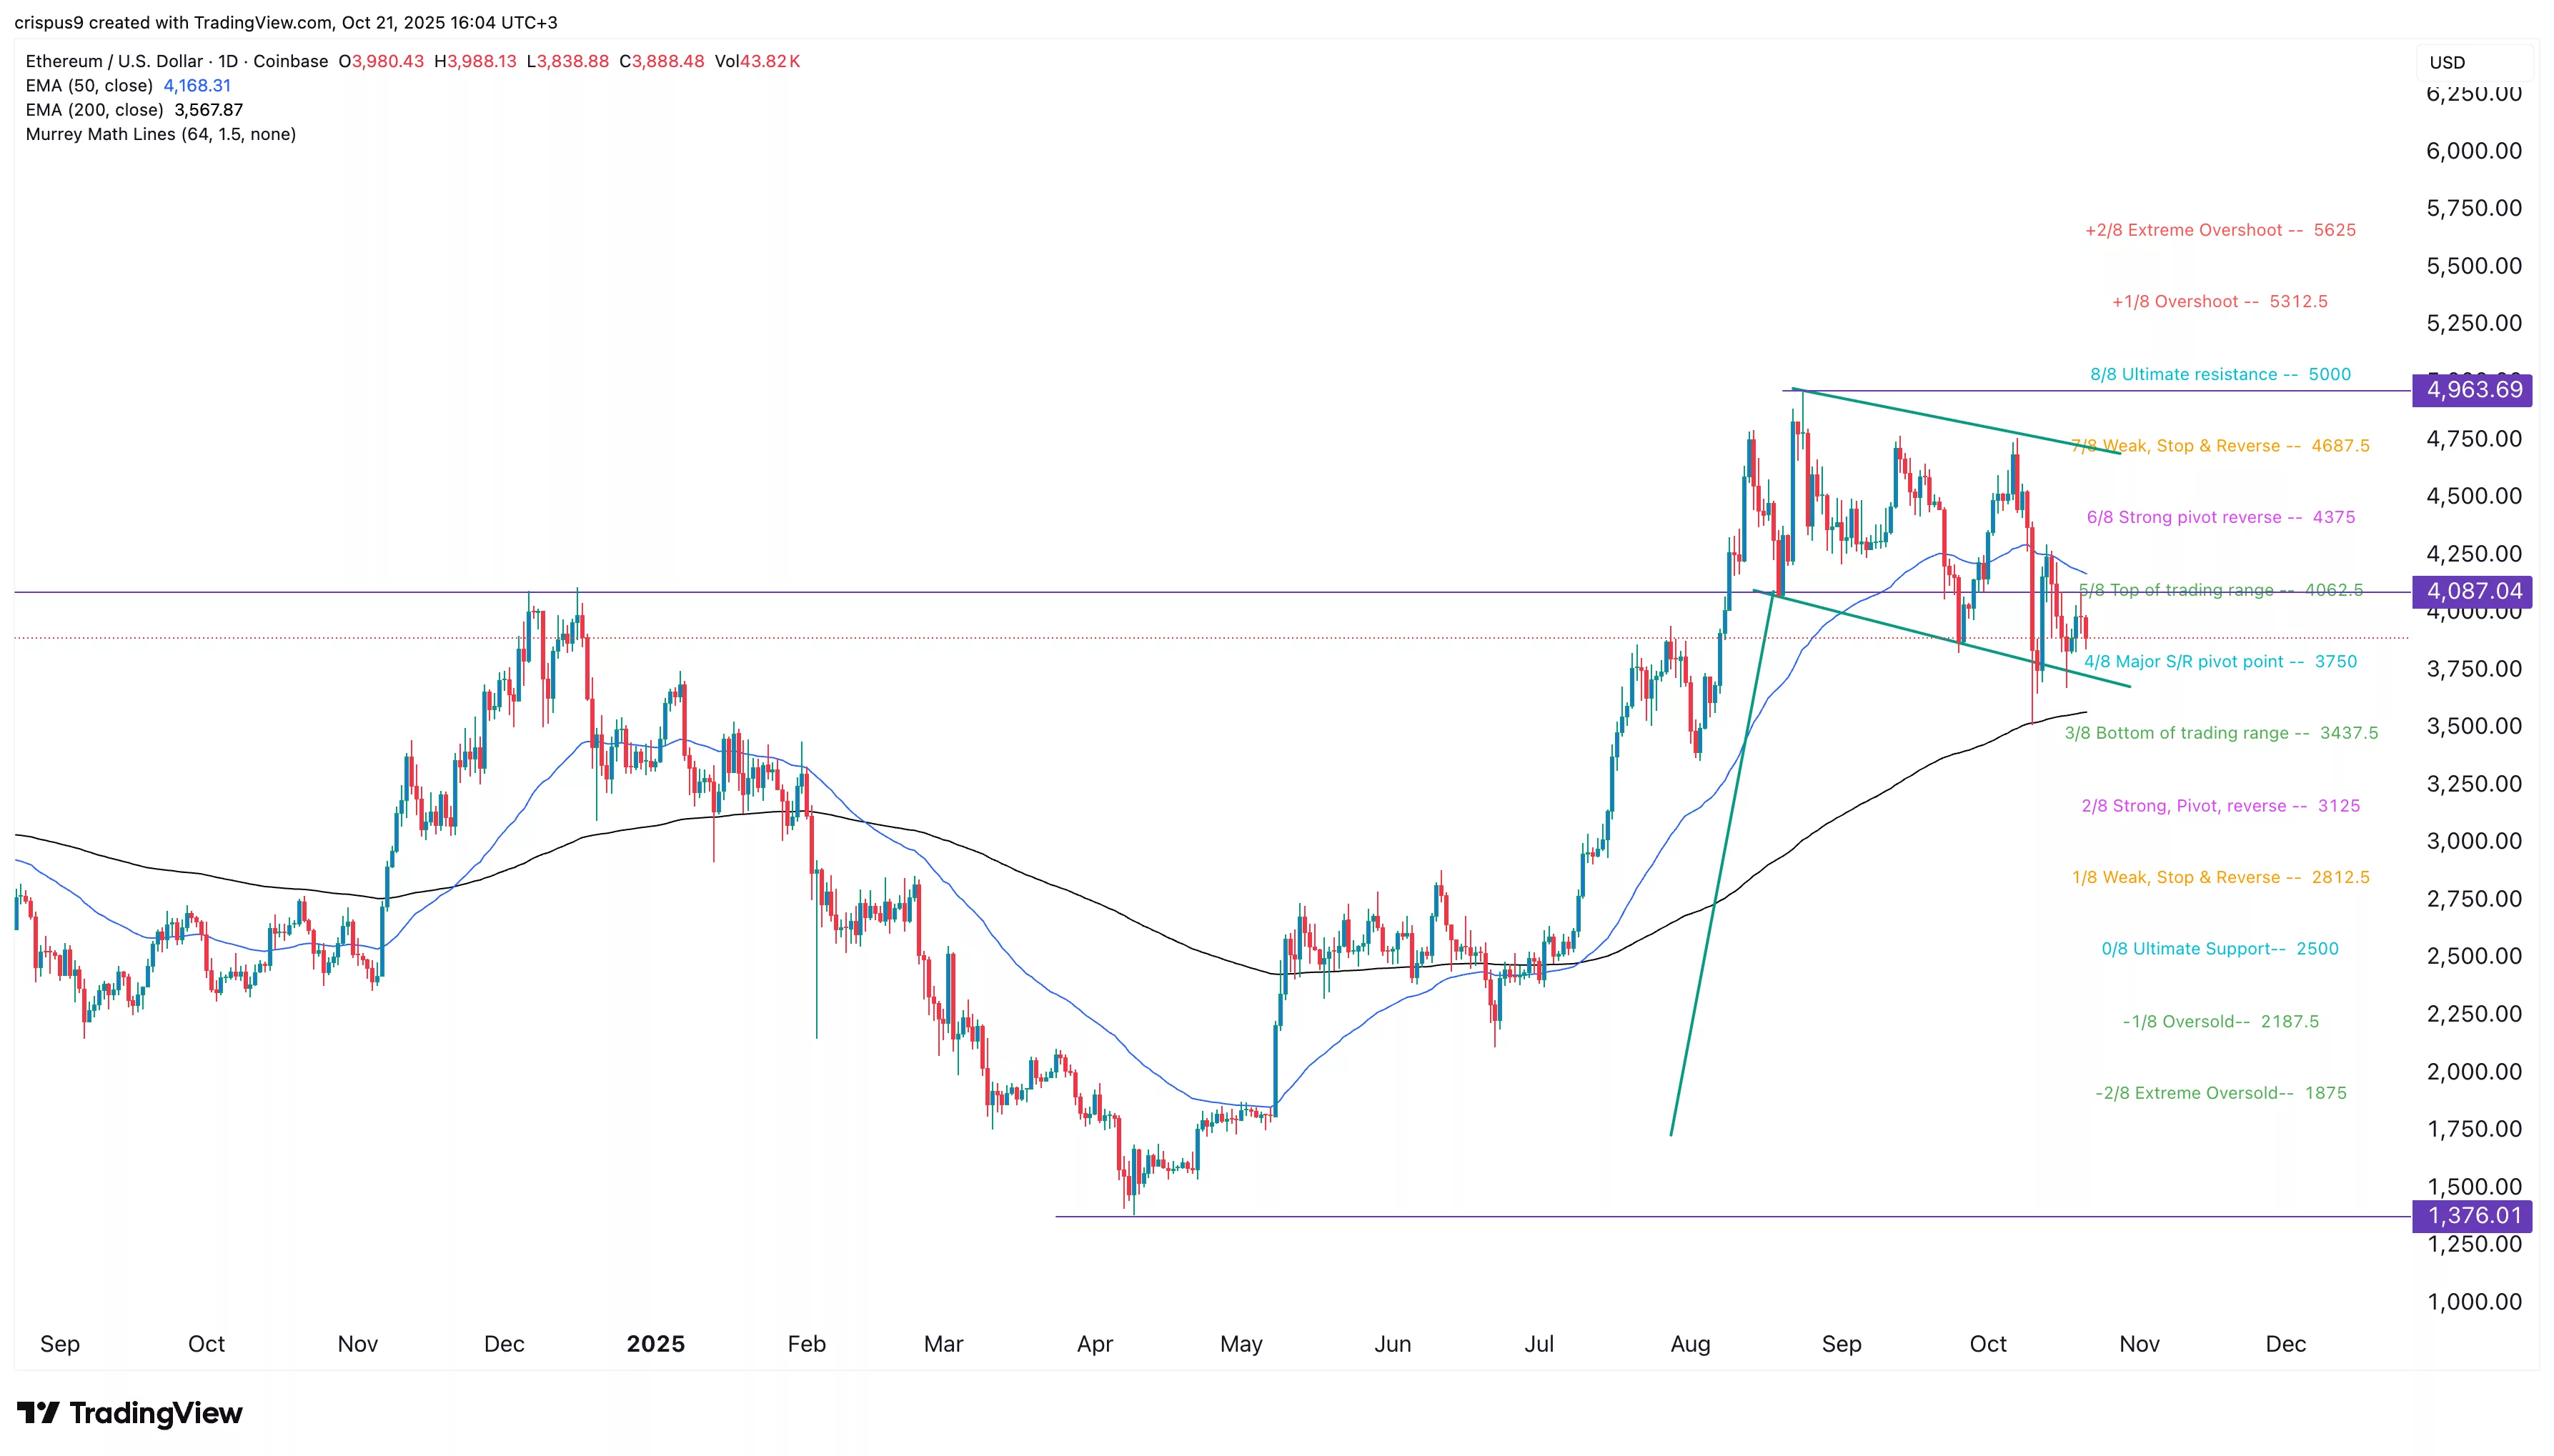
The daily timeframe chart shows that Ethereum’s price has pulled back in the past few months. The price has dropped from a high of $4,963 in August to $3,900 today.
The coin has moved below the important support level at $4,087, which was the highest point on Dec. 6 and Dec. 24 last year. The price also moved below the 50-day Exponential Moving Average.
On the positive side, Ethereum has held steady above the 200-day moving average at $3,570. The price has also formed a bullish flag pattern, which often leads to a strong bullish breakout.
The price is now in the descending channel of this pattern after completing the flagpole. Also, the coin is slightly above the Major S/R pivot point at $3,750.
Therefore, the token will likely bounce back in the coming days, with the initial target at the weak stop-and-reverse point of the Murrey Math Lines tool. A move above that level will point to more gains, potentially to the ultimate resistance at $5,000.
ETH supply in exchanges is falling
One of the top catalysts for Ethereum price is that there is robust demand from investors despite the recent ETF outflows. Data shows that these funds have had over $14 billion in inflows since their inception in July last year. They now hold coins worth about $26 billion or 5.56% of the market cap.
Another sign of Ethereum demand is that exchange balances have continued falling this year. Exchange balances have plunged from 27 million in 2022 to 15.9 million today. Falling exchange reserves are a sign that investors are moving their coins to self-custody.
Meanwhile, more investors are staking ETH coins. StakingRewards data shows that the staking market cap stands at $140 billion, while the staking ratio is at 30%.
Ethereum’s network is doing well, especially in the stablecoin industry. Stablecoin supply has jumped by 1.35% in the last 30 days to $167 billion, while the adjusted transaction volume hit $1 trillion.