Is Ethereum price topping out? daily bearish divergence signals reversal


Ethereum price is rejecting near $3,400 as daily bearish divergence forms and volume fades, increasing the probability of a corrective move toward $2,800 high-time-frame support.
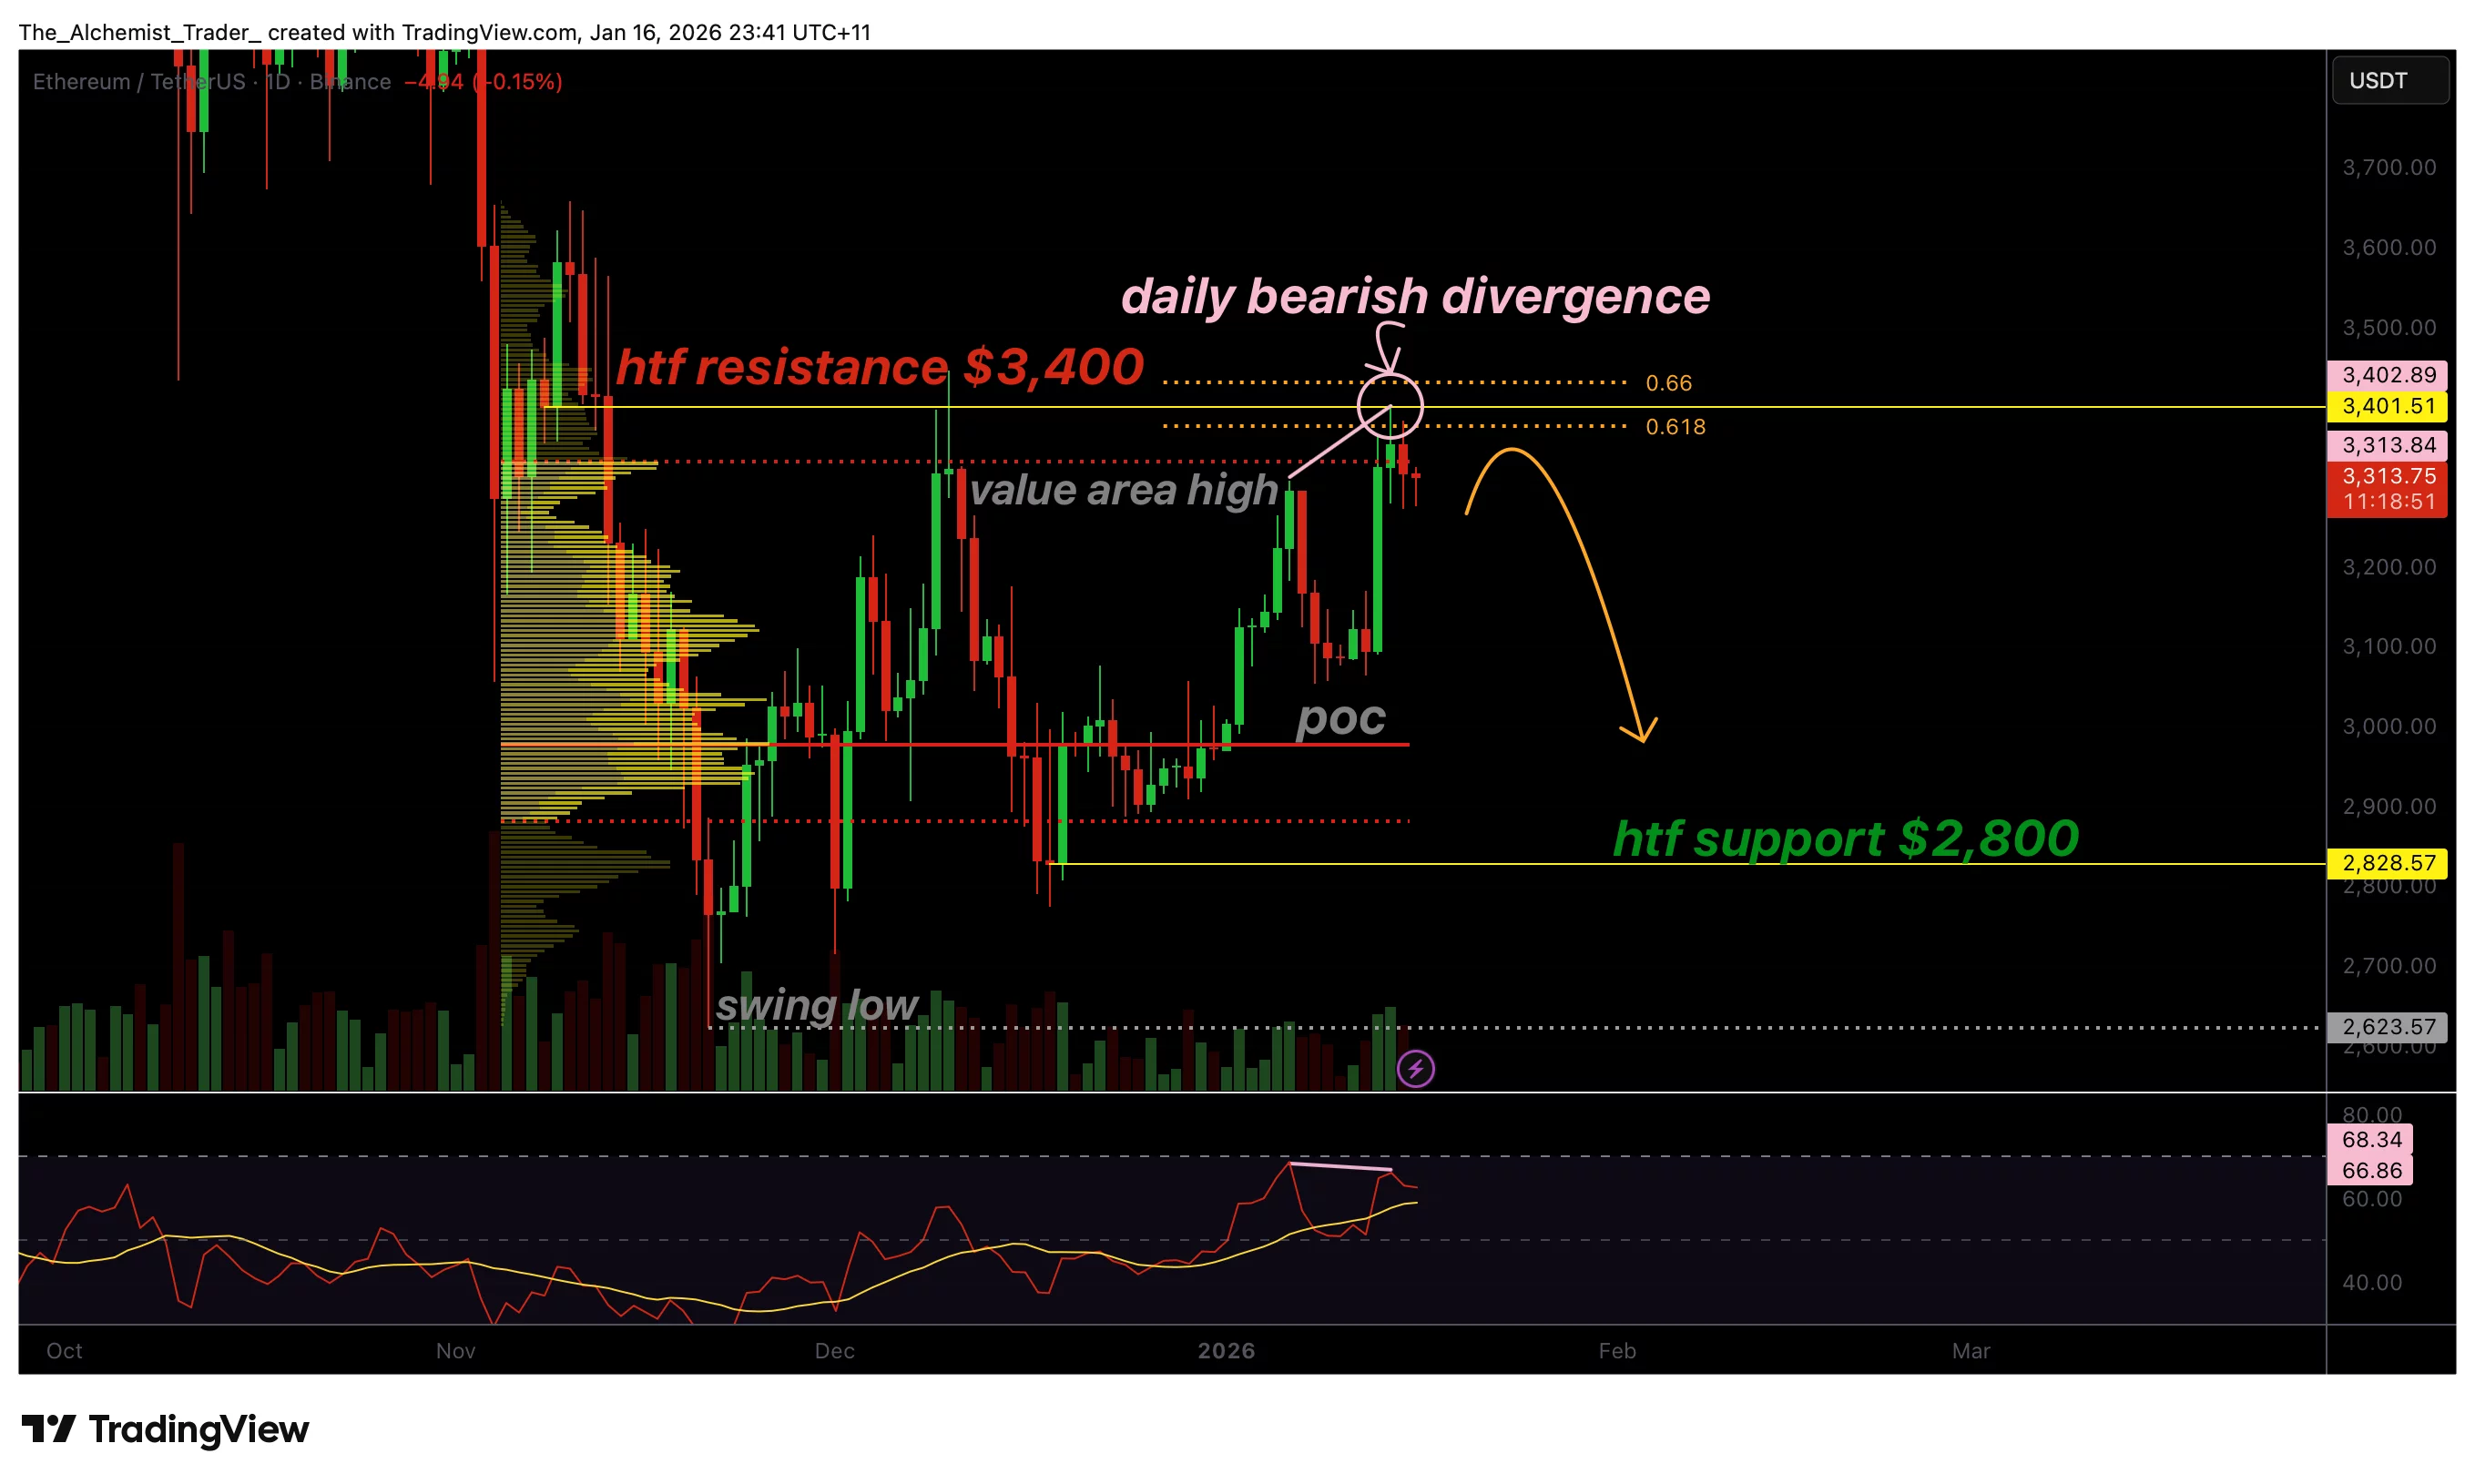
- ETH rejected at $3,400 resistance with VAH + 0.618 confluence
- Daily bearish RSI divergence signals momentum weakness at the highs
- Fading volume increases pullback odds toward $2,800 support
Ethereum’s (ETH) price recent rally is showing early signs of exhaustion as price fails to hold above the key $3,400 high-time-frame resistance zone. While ETH has remained strong overall, the market is now flashing technical warning signals that often appear near local tops, particularly when resistance aligns with weakening momentum.
Ethereum price key technical points
- Ethereum rejected from $3,400 resistance, a high-confluence technical zone
- ETH is printing daily bearish divergence as RSI weakens despite higher price highs
- Declining volume strengthens the case for a pullback toward $2,800 support
The $3,400 region remains one of Ethereum’s most important structural resistance levels. Price pushed into this zone with strong momentum, but the market has now shown signs of rejection, indicating that sellers are actively defending the level.
This zone is reinforced by multiple technical factors. The value area high represents the upper boundary of accepted value within the current range structure, meaning price is trading into a premium area where distribution is more likely to occur. At the same time, the 0.618 Fibonacci retracement adds a critical decision level that often separates continuation from reversal.
When Ethereum rejects from this type of high-confluence region, it typically signals one of two outcomes: either a deeper consolidation before attempting another breakout, or the start of a corrective move back into lower range value.
Daily bearish divergence signals weakening momentum
The most notable signal on the chart is the daily bearish divergence. This divergence occurs when price prints a new high while momentum indicators like RSI print a lower high. In simple terms, Ethereum is pushing higher in price, but the momentum behind the move is fading.
This matters because daily divergences carry greater weight than intraday signals. Higher-time-frame divergences reflect broader market participation and often reveal when demand is weakening across multiple sessions, not just a temporary intraday pause.
Bearish divergence at resistance is often associated with topping behavior because it signals that buyers are struggling to maintain the same strength as the price rises. While price may still attempt additional upside briefly, the divergence suggests the market is increasingly vulnerable to a reversal if sellers begin to press the downside.
Volume decline adds another layer of risk
Volume behavior supports the topping narrative. Ethereum’s push higher has shown signs of waning participation, a common characteristic of weakening rallies. Strong breakout conditions typically require expanding volume, as buyers step in aggressively to push the price through resistance with conviction.
When volume fades during a rally, it often suggests that the move is being driven by reduced sell pressure rather than strong demand. This creates an unstable structure, where price becomes more sensitive to rejection once resistance is reached.
In Ethereum’s current setup, the combination of rejection near $3,400, bearish divergence on the daily chart, and weakening volume creates a technical environment where reversal risk becomes increasingly difficult to ignore.
Downside target: $2,800 high-time-frame support
If Ethereum continues to reject at $3,400 and the bearish divergence plays out, the next major technical target is $2,800, the high-time-frame support. This zone represents the next significant demand region where buyers are likely to defend the price.
A move toward $2,800 would also align with typical price-range behavior, where price rotates from value-area highs back toward lower support levels to rebalance and capture liquidity. In this sense, the correction would not necessarily imply a full macro bearish trend; it would instead represent a healthy reset within a broader structure, especially if $2,800 holds as support.
However, if Ethereum fails to hold $2,800 on a closing basis, the market could enter a deeper corrective phase. This makes the level a critical pivot for determining whether the pullback is temporary or more structural.
What to expect in the coming price action
Ethereum is likely to remain sensitive around the $3,400 resistance zone in the near term. If price continues to reject and bearish divergence remains active, the probability favors a pullback toward $2,800 support, especially if volume continues to fade.
A bullish continuation scenario would require Ethereum to reclaim $3,400 with strong volume and multiple closes above the resistance level, neutralizing the divergence signal. Until that occurs, however, the technical evidence supports increased reversal risk.