BTC price tests $92K support as liquidations mount, but reversal setup signals recovery


BTC price briefly fell below the $92k support level on Monday as $440 million in liquidations hit the market.
- Bitcoin price retested the $92k support after bulls faced rejection at $94,000.
- Long liquidations and outflows from spot BTC ETFs fueled the losses.
- A bullish reversal pattern has been forming on the daily chart.
After rallying to a 7-week high of around $94,400 on Tuesday, Bitcoin (BTC) faced a sharp dip to $91,540 before backpedaling some of its losses and settling at $92,670 at press time.
Analysts believe Bitcoin’s price was pressured by profit-taking after the market’s sharp rebound following late 2025 lows. Short-term traders were likely locking in gains as BTC has climbed nearly 12% from its December lows near $84,500.
Today, BTC price also faced pressure from massive liquidations that tend to accelerate downside moves. Data from CoinGlass shows that nearly $441.5 million worth of positions were liquidated in the past 24 hours, with $288.02 million coming from long positions.
When long positions get liquidated, traders’ positions are automatically closed by the exchange, which in turn tends to intensify selling pressure and push prices lower in a short span of time.
Adding to the bearish pressure, institutional traders have once again moved away from the market just days after BlackRock’s IBIT recorded the largest inflows in over 3 months. The 12-spot Bitcoin ETFs have now shifted back to net outflows, shedding $243 million over the past day, data compiled by SoSoValue show.
However, Bitcoin’s quick recovery above $92,000 suggests that the underlying market structure remains resilient. The fact that the Crypto Fear and Greed Index has stabilized at a neutral 49 indicates that the recent dip functioned more as a necessary liquidity reset rather than a fear-driven sell-off.
BTC price analysis
On the daily chart, Bitcoin has been forming a double bottom pattern, a bullish reversal formation that historically precedes short-term rallies once confirmed. At press time, Bitcoin had failed to sustain its move past the pattern’s $94,480 neckline, resulting in a minor rejection.
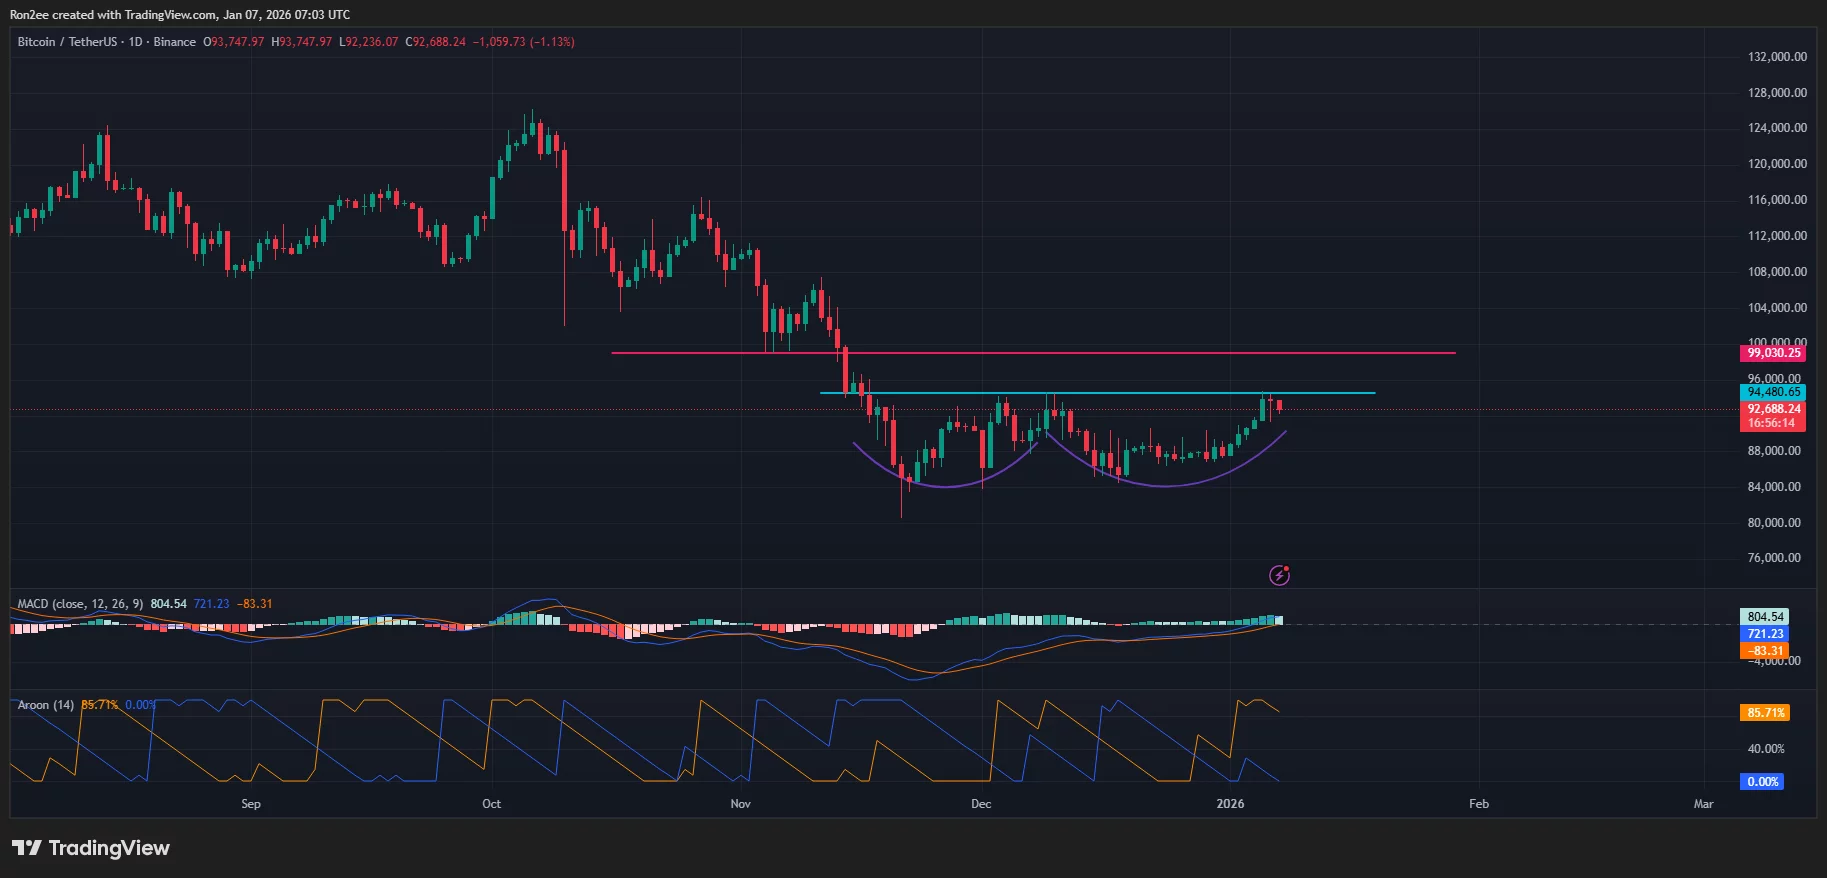
However, technical indicators, notably the Aroon Up, remain high at 85.71%, while the MACD lines have moved above the zero line and are pointing upward, signaling underlying strength.
The MACD lines, which have moved above the zero line and are pointed upwards, also hint that there is underlying bullish strength supporting the price action.
A successful breakout could see bulls push to reclaim the $99,000 area. Conversely, if Bitcoin fails to clear the $94,400 resistance, it could trigger a retracement toward the $85,000 to $88,000 zone, which served as an important support level during the December correction.
Disclosure: This article does not represent investment advice. The content and materials featured on this page are for educational purposes only.