Bitcoin price rally stalls at $97,600 as fibonacci level triggers rejection risk


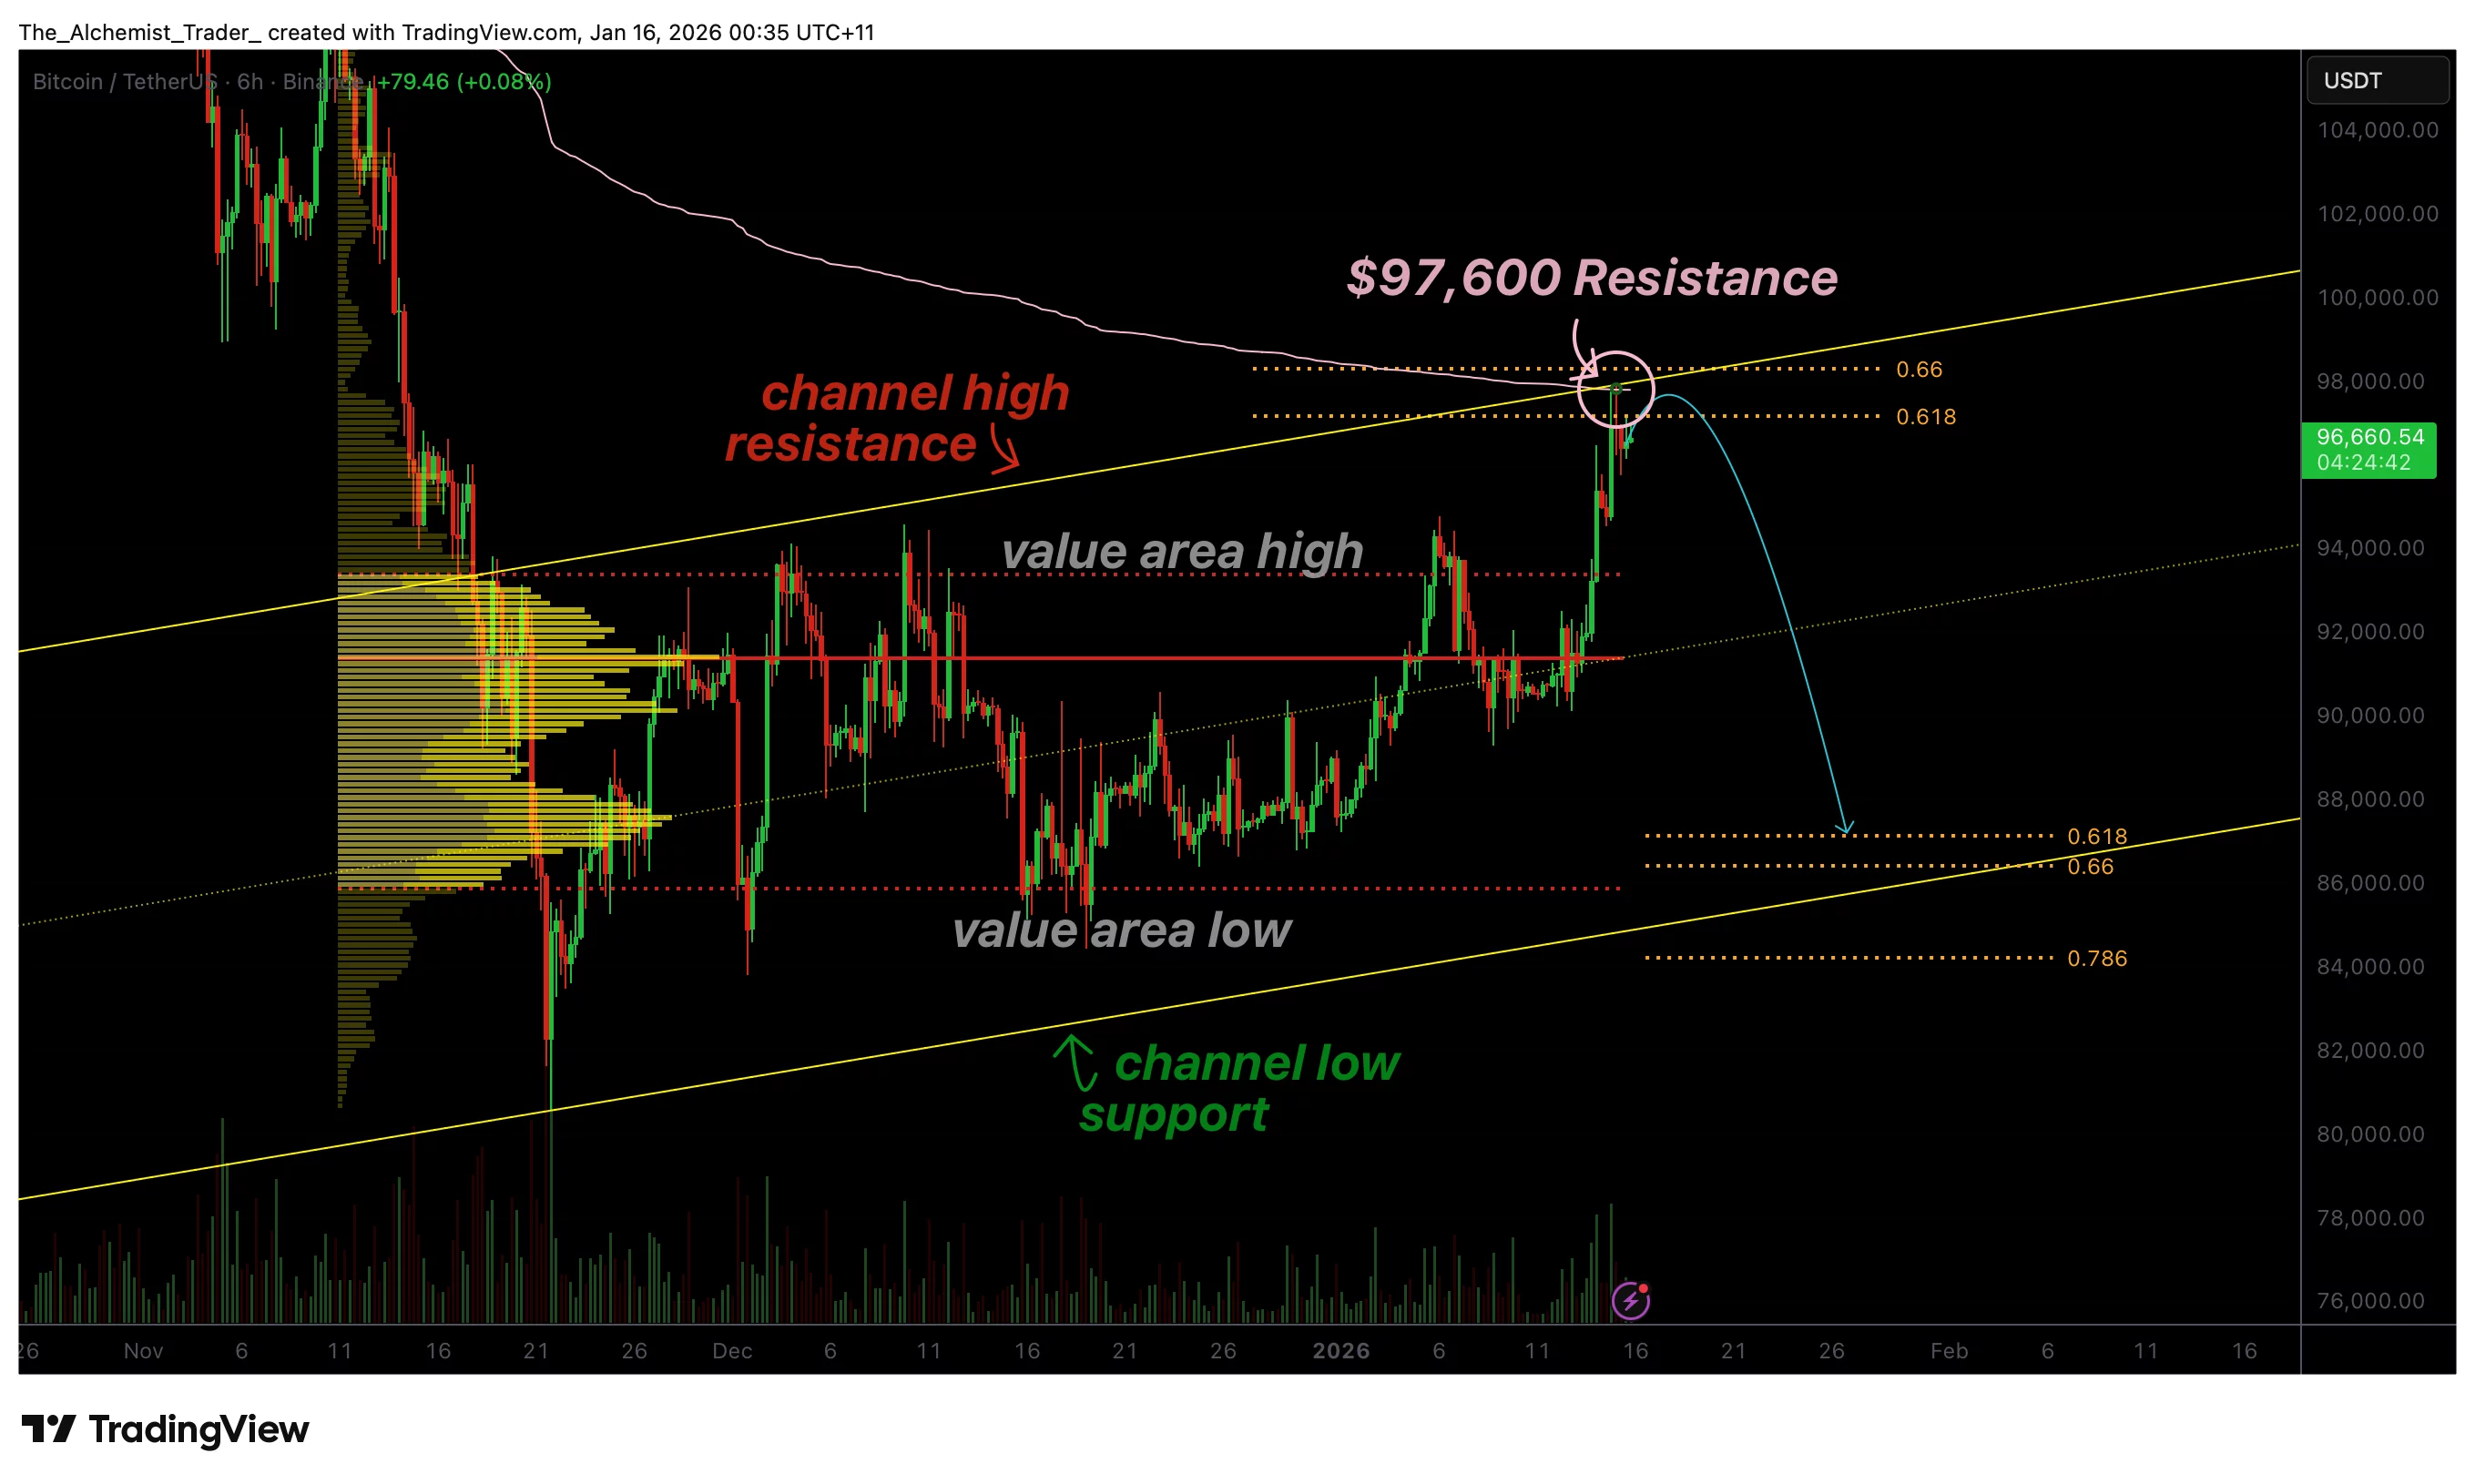
Bitcoin price is stalling near $97,600 as price hits 0.618 Fibonacci resistance, raising rejection risk and increasing the probability of a corrective rotation back toward channel support.
- BTC stalled at $97,600 0.618 Fibonacci resistance
- Confluence includes channel high + higher-time-frame VWAP
- Weak volume increases downside odds toward channel low + value area low
Bitcoin’s (BTC) latest rally has been highly technical, with price advancing into a major high-time-frame resistance region near $97,600. This level is significant because it lies at the intersection of several key confluence zones, including the 0.618 Fibonacci retracement, the upper boundary of a broader trading channel, and a VWAP level anchored to higher price levels.
Bitcoin price key technical points
- Bitcoin is stalling near $97,600, aligned with the 0.618 Fibonacci resistance
- Confluence includes channel high resistance and a higher-time-frame VWAP level
- Weak follow-through volume increases the risk of rotation toward channel low support
The $97,600 region is not random resistance. It represents a stacked zone of technical confluence, which often attracts selling interest and creates a high-probability inflection point.
First, the 0.618 Fibonacci retracement is widely respected across markets as a key decision level. It frequently acts as a pivot where price either breaks through and continues trending or rejects and rotates lower to rebalance value. When Bitcoin stalls at a 0.618 Fibonacci level, it often signals that buyers are losing momentum and the market is struggling to sustain acceptance above resistance.
Second, this Fibonacci level lines up with the upper boundary of Bitcoin’s broader trading channel. Channel highs are commonly defended by sellers because they represent premium pricing within a range structure. When price reaches the channel high, it often triggers profit-taking and short positions, particularly when volume confirmation is lacking.
Finally, VWAP confluence introduces an additional layer of resistance. When VWAP is derived from higher-time-frame reference points and aligns with Fibonacci and structural resistance levels, it further strengthens the zone. VWAP often acts as a benchmark for “fair value,” and when price trades into it at resistance, markets frequently rotate away unless demand remains dominant.
Shallow volume signals weak conviction
One of the most telling elements in Bitcoin’s current move is how volume has behaved during the rally. While price advanced into resistance, the volume profile shows that the rise has been relatively shallow rather than impulsive. In strong continuation rallies, volume often expands aggressively as buyers push through resistance with conviction.
In this case, the lack of strong volume suggests that the rally may be more corrective than trend-driven. This is an important distinction. Corrective rallies often stall at major confluence zones and reverse, as they represent short-covering or temporary relief rather than sustainable demand accumulation.
This is also reflected in volume nodes, which appear thin compared to what would typically accompany a breakout attempt. Without clear participation entering at higher levels, Bitcoin becomes vulnerable to rejection and liquidation-driven downside continuation.
Trading channel context keeps range rotation in play
Bitcoin’s broader structure remains defined by a high-time-frame trading channel. As long as price remains contained within this channel, rotational behavior is expected. That means rallies into channel highs often rotate back toward channel lows, and support tests frequently lead to rebounds unless the market breaks down decisively.
With Bitcoin stalling at channel resistance, the market is now at a potential pivot where sellers could regain control and push the price back toward lower areas of value. If the rejection confirms, a rotation back toward the channel low becomes the higher-probability outcome.
This does not necessarily signal a full macro bearish reversal. Instead, it suggests that Bitcoin may continue trading in range rotations until the market produces a decisive breakout backed by strong volume and acceptance.
What to expect in the coming price action
Bitcoin is currently at a technically important inflection point. The rally is stalling at a high-confluence resistance zone near $97,600, and the lack of impulsive volume increases the risk of rejection. As long as price remains capped below this resistance and fails to reclaim it on a closing basis, the probability favors a deeper corrective rotation back toward channel support and the value area low.