Bitcoin price eyes symmetrical triangle breakout as weekly ETF outflows top $780M


Bitcoin price is eyeing a breakout from a consolidation pattern as buyers reclaimed control. At the same time, spot BTC exchange-traded funds have witnessed over $780 million in net outflows.
- Bitcoin price reclaimed $90,000 level on Monday.
- Renewed Russia-Ukraine tensions and rising BTC price speculation fueled the rebound.
- A bullish symmetrical triangle pattern had formed on the 4-hour chart.
According to data from Coin Insider Daily, Bitcoin (BTC) price fell from its $90,000 mark on Dec. 22 and subsequently slipped to as low as $86,740 by Christmas Eve. While bulls tried reclaiming the $90k level once again, they were cut short at a little over $89,000 on Friday and traded within the $87,000-$88,000 zone over the weekend.
Bitcoin price fell last week amid persistent outflows from its spot ETF funds, a reversal from significant inflows seen throughout most of the second and third quarters this year that had supported Bitcoin’s rally toward its all-time high of $126,080 in October.
Per data from SoSoValue, the twelve spot BTC ETFs witnessed $782 million in net outflows between Dec. 22 and Dec. 26, continuing the outflow trend that has seen $1.08 billion exit the investment products so far in December, and $3.48 billion in the previous month.
Such outflows signal that the long-term conviction from institutional traders remains weak and would likely continue to keep investor sentiment subdued.
Further, Bitcoin price was kept in check amid reduced expectations of Fed rate cuts for January and the following months, as recent comments from the Fed Chair and key officials indicated a more cautious stance around rate cuts.
Per data from Polymarket, the odds of a 25 basis point were at 13% at press time, while the odds of no change were at 87%.
On Monday, Dec. 25, BTC managed to recover back above $90,000 to a little over $90,200 briefly, before settling at $89,830 at press time.
Bitcoin’s uptick today appears to be driven by renewed geopolitical tension between Russia and Ukraine on Sunday, which drove oil prices higher and subsequently prompted traders to move their capital into safe-haven assets, including Bitcoin, which is often seen as a digital hedge against uncertainty.
BTC price gains were also supported by an uptick in demand from derivative traders. Notably, short-term retail traders appear to be driving much of the recent activity.
Data from CoinGlass shows that the Bitcoin weighted funding rate has moved to one of its highest levels since October, a telltale sign that more investors are betting on further upside in Bitcoin price, at least in the short term.
Bitcoin futures open interest has also moved up 7% in the past 24 hours, a sign of more participants entering the market, which in turn could have a reinforcing effect on its prices.
Bitcoin price analysis
On the 4-hour chart, Bitcoin price action has been forming a symmetrical triangle since mid-November this year. While it tends to be a neutral formation, a breach of the upper trendline typically serves as a bullish trigger for sustained upside rallies.
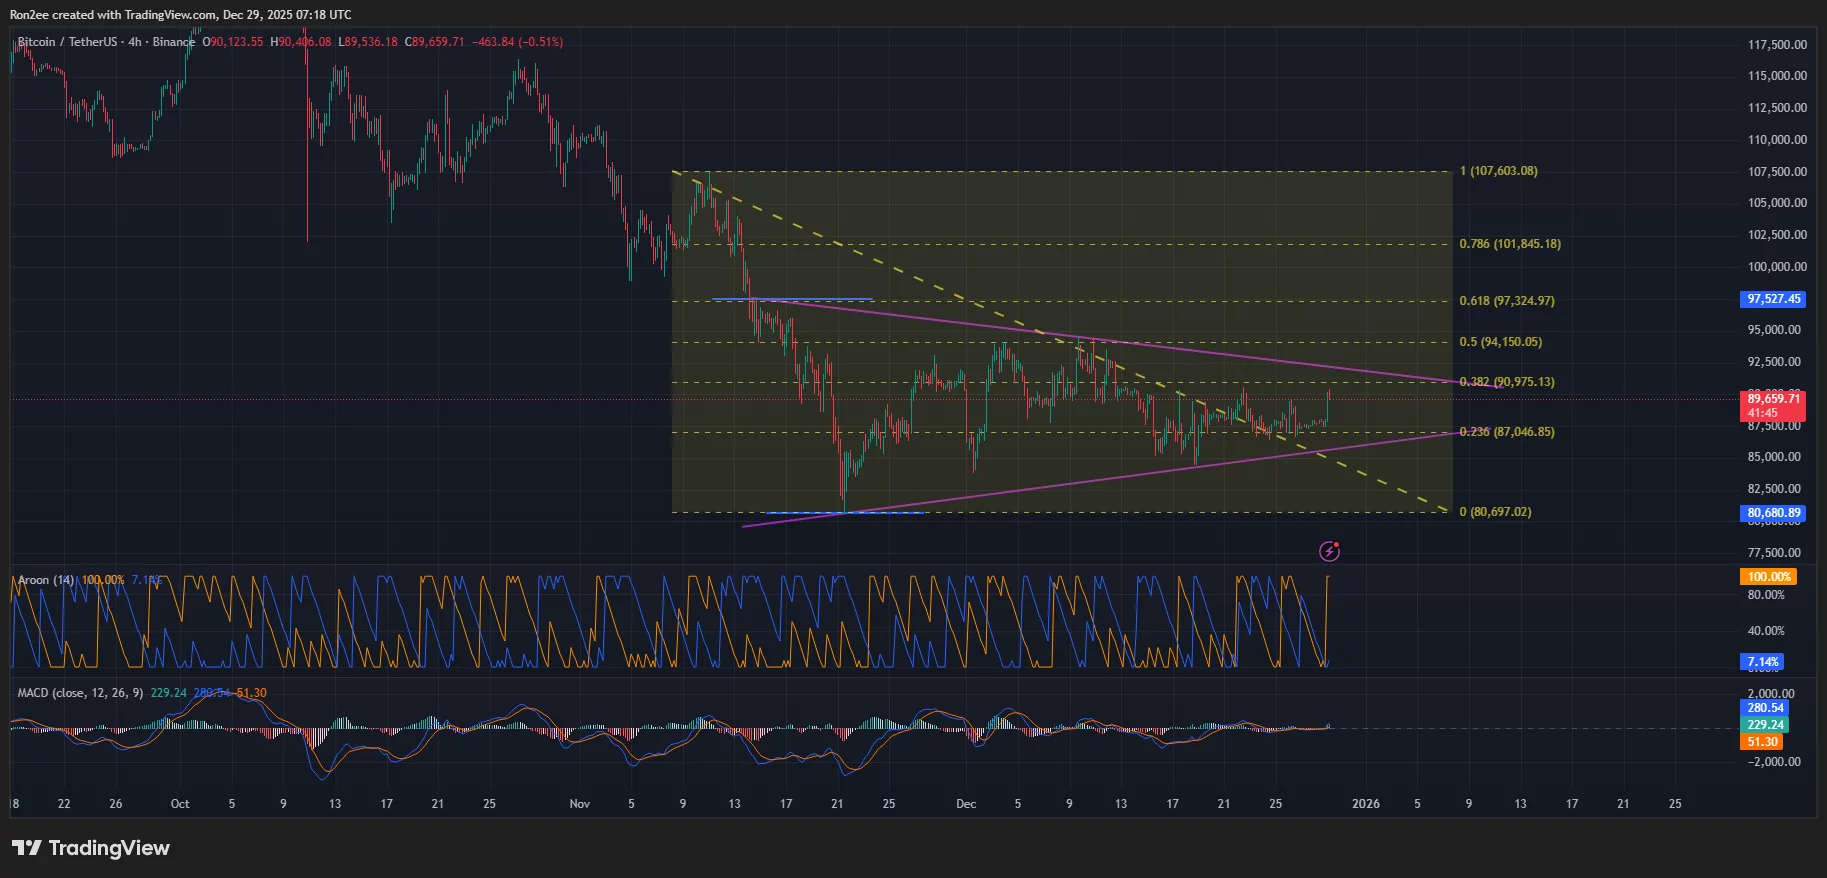
At press time, bulls appear to have the technical advantage over the market. The Aroon Up reached 100% against an Aroon Down of 7.14%, marking a stark contrast and signaling much stronger buyer demand over selling pressure.
Additionally, the MACD lines have also moved above the zero line and are trending upwards, which further confirms a reversal of trend toward bullish momentum.
As such, traders will be closely watching the $90,975, which aligns with the 38.2% Fibonacci retracement level. A decisive break above the level with strong volume could confirm the pattern breakout and subsequently push its price to as high as $94,200, a level where bulls managed to reach earlier this month before receding.
While momentum favors the upside, a close below the $87,000 support zone would invalidate the immediate bullish thesis, potentially exposing Bitcoin to a retreat toward the $85,000 psychological level.
Disclosure: This article does not represent investment advice. The content and materials featured on this page are for educational purposes only.